Icelander vs Yup'ik Male Poverty
COMPARE
Icelander
Yup'ik
Male Poverty
Male Poverty Comparison
Icelanders
Yup'ik
11.0%
MALE POVERTY
68.5/ 100
METRIC RATING
147th/ 347
METRIC RANK
20.4%
MALE POVERTY
0.0/ 100
METRIC RATING
343rd/ 347
METRIC RANK
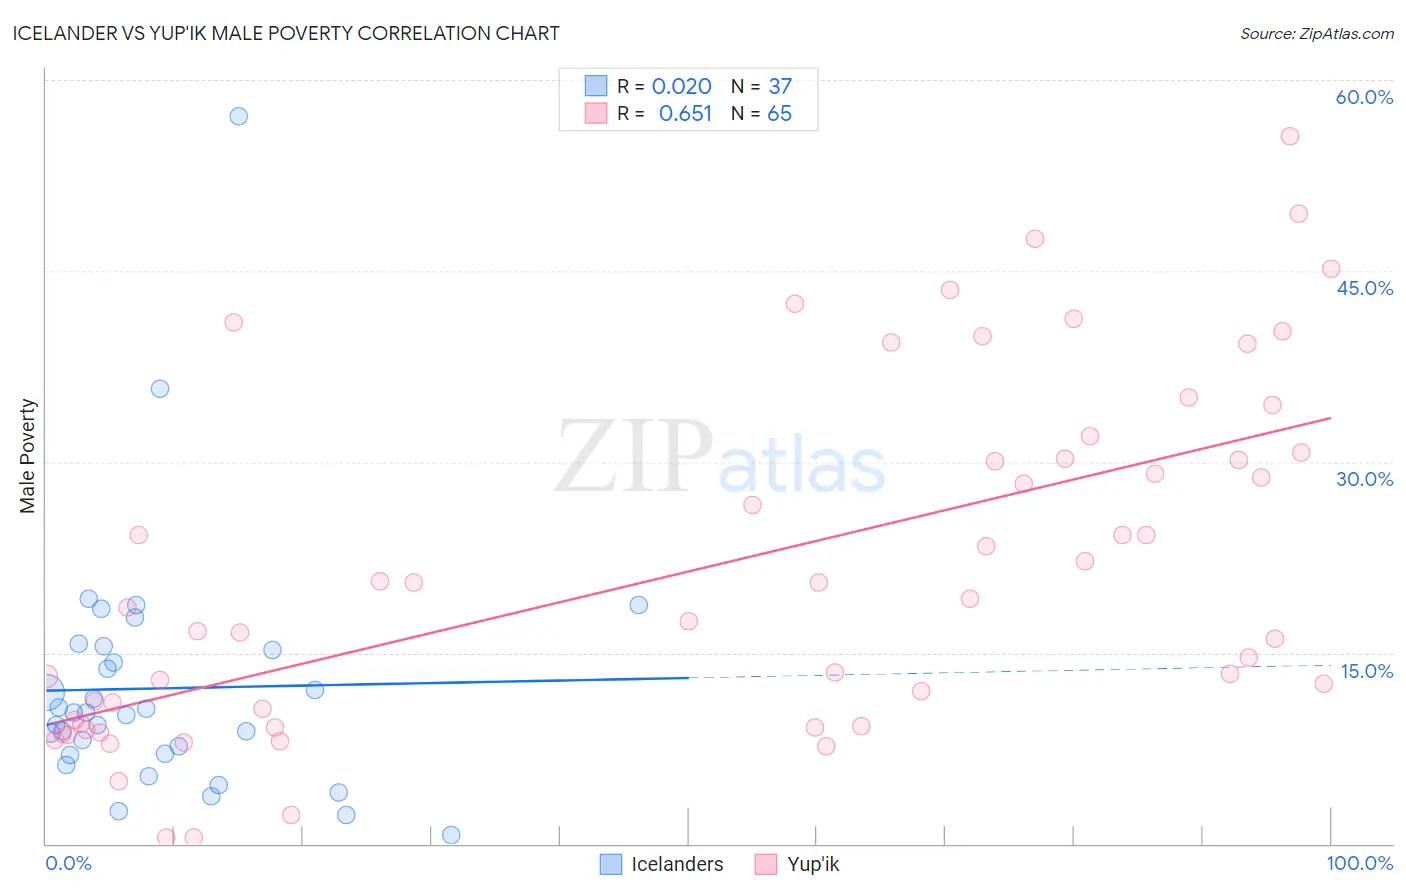
Icelander vs Yup'ik Male Poverty Correlation Chart
The statistical analysis conducted on geographies consisting of 159,599,836 people shows no correlation between the proportion of Icelanders and poverty level among males in the United States with a correlation coefficient (R) of 0.020 and weighted average of 11.0%. Similarly, the statistical analysis conducted on geographies consisting of 39,962,746 people shows a significant positive correlation between the proportion of Yup'ik and poverty level among males in the United States with a correlation coefficient (R) of 0.651 and weighted average of 20.4%, a difference of 85.8%.
Male Poverty Correlation Summary
| Measurement | Icelander | Yup'ik |
| Minimum | 0.64% | 0.50% |
| Maximum | 57.1% | 55.6% |
| Range | 56.5% | 55.1% |
| Mean | 12.2% | 21.5% |
| Median | 10.3% | 18.6% |
| Interquartile 25% (IQ1) | 7.0% | 9.4% |
| Interquartile 75% (IQ3) | 15.4% | 30.5% |
| Interquartile Range (IQR) | 8.3% | 21.1% |
| Standard Deviation (Sample) | 10.0% | 13.7% |
| Standard Deviation (Population) | 9.8% | 13.6% |
Similar Demographics by Male Poverty
Demographics Similar to Icelanders by Male Poverty
In terms of male poverty, the demographic groups most similar to Icelanders are Armenian (11.0%, a difference of 0.050%), Immigrants from Venezuela (11.0%, a difference of 0.070%), Guamanian/Chamorro (11.0%, a difference of 0.11%), Venezuelan (11.0%, a difference of 0.13%), and Immigrants from Nepal (11.0%, a difference of 0.14%).
| Demographics | Rating | Rank | Male Poverty |
| Tlingit-Haida | 76.1 /100 | #140 | Good 10.9% |
| Immigrants | France | 75.8 /100 | #141 | Good 10.9% |
| Basques | 74.6 /100 | #142 | Good 10.9% |
| Afghans | 71.9 /100 | #143 | Good 10.9% |
| Samoans | 71.8 /100 | #144 | Good 10.9% |
| Immigrants | Germany | 71.6 /100 | #145 | Good 10.9% |
| Syrians | 71.4 /100 | #146 | Good 10.9% |
| Icelanders | 68.5 /100 | #147 | Good 11.0% |
| Armenians | 68.0 /100 | #148 | Good 11.0% |
| Immigrants | Venezuela | 67.9 /100 | #149 | Good 11.0% |
| Guamanians/Chamorros | 67.6 /100 | #150 | Good 11.0% |
| Venezuelans | 67.4 /100 | #151 | Good 11.0% |
| Immigrants | Nepal | 67.3 /100 | #152 | Good 11.0% |
| Immigrants | Bosnia and Herzegovina | 65.2 /100 | #153 | Good 11.0% |
| Immigrants | Kazakhstan | 64.8 /100 | #154 | Good 11.0% |
Demographics Similar to Yup'ik by Male Poverty
In terms of male poverty, the demographic groups most similar to Yup'ik are Pima (20.4%, a difference of 0.10%), Lumbee (20.2%, a difference of 0.88%), Immigrants from Yemen (20.1%, a difference of 1.2%), Hopi (20.8%, a difference of 2.1%), and Yuman (19.5%, a difference of 4.3%).
| Demographics | Rating | Rank | Male Poverty |
| Natives/Alaskans | 0.0 /100 | #333 | Tragic 16.9% |
| Cheyenne | 0.0 /100 | #334 | Tragic 17.6% |
| Apache | 0.0 /100 | #335 | Tragic 17.7% |
| Pueblo | 0.0 /100 | #336 | Tragic 18.5% |
| Sioux | 0.0 /100 | #337 | Tragic 18.7% |
| Crow | 0.0 /100 | #338 | Tragic 19.1% |
| Yuman | 0.0 /100 | #339 | Tragic 19.5% |
| Immigrants | Yemen | 0.0 /100 | #340 | Tragic 20.1% |
| Lumbee | 0.0 /100 | #341 | Tragic 20.2% |
| Pima | 0.0 /100 | #342 | Tragic 20.4% |
| Yup'ik | 0.0 /100 | #343 | Tragic 20.4% |
| Hopi | 0.0 /100 | #344 | Tragic 20.8% |
| Puerto Ricans | 0.0 /100 | #345 | Tragic 22.0% |
| Navajo | 0.0 /100 | #346 | Tragic 22.3% |
| Tohono O'odham | 0.0 /100 | #347 | Tragic 22.9% |