Mexican American Indian vs Yup'ik Male Poverty
COMPARE
Mexican American Indian
Yup'ik
Male Poverty
Male Poverty Comparison
Mexican American Indians
Yup'ik
13.0%
MALE POVERTY
0.1/ 100
METRIC RATING
254th/ 347
METRIC RANK
20.4%
MALE POVERTY
0.0/ 100
METRIC RATING
343rd/ 347
METRIC RANK
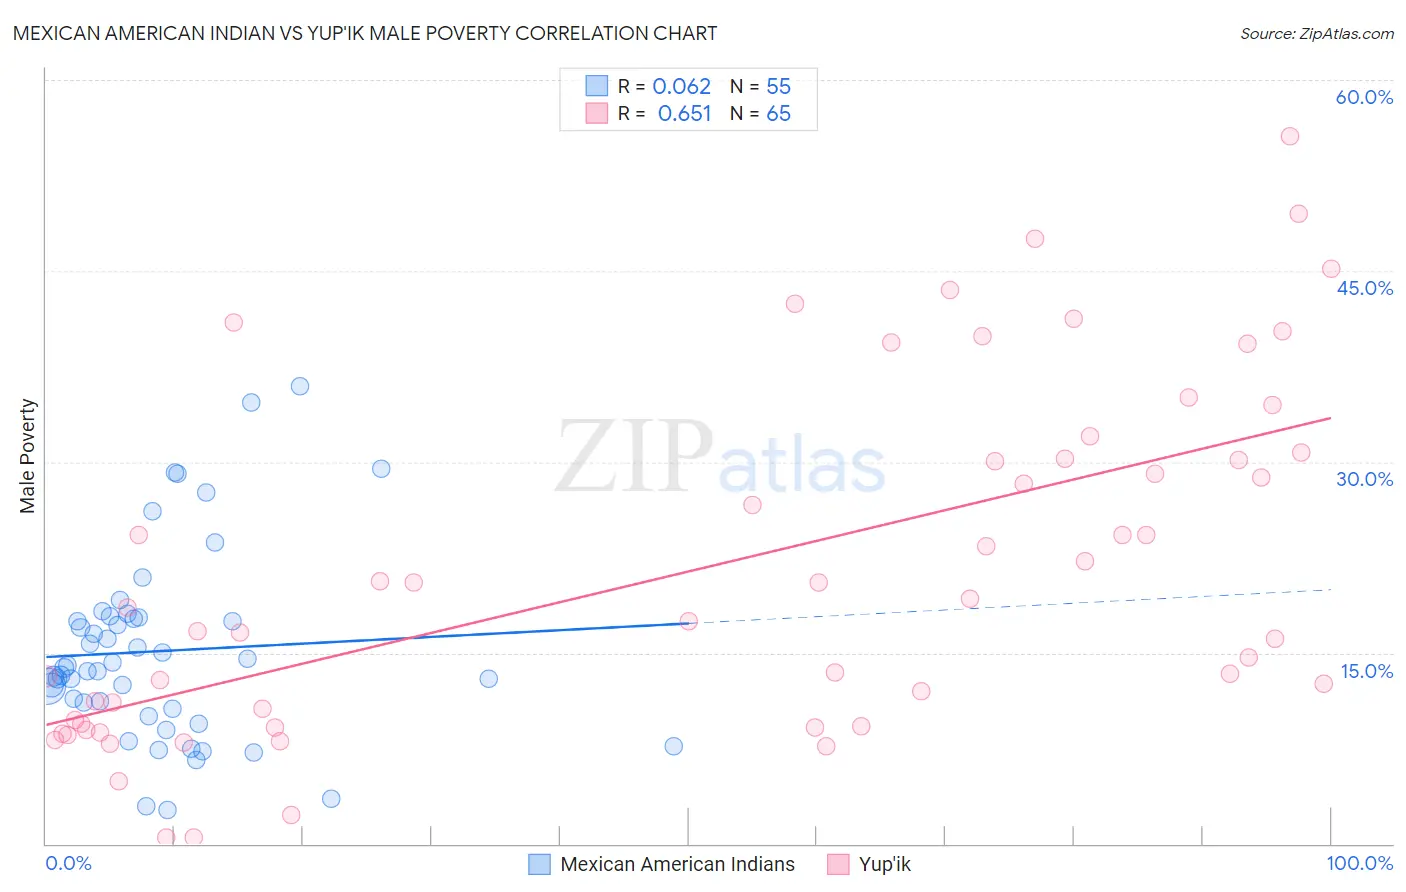
Mexican American Indian vs Yup'ik Male Poverty Correlation Chart
The statistical analysis conducted on geographies consisting of 317,482,192 people shows a slight positive correlation between the proportion of Mexican American Indians and poverty level among males in the United States with a correlation coefficient (R) of 0.062 and weighted average of 13.0%. Similarly, the statistical analysis conducted on geographies consisting of 39,962,746 people shows a significant positive correlation between the proportion of Yup'ik and poverty level among males in the United States with a correlation coefficient (R) of 0.651 and weighted average of 20.4%, a difference of 57.1%.
Male Poverty Correlation Summary
| Measurement | Mexican American Indian | Yup'ik |
| Minimum | 2.6% | 0.50% |
| Maximum | 35.9% | 55.6% |
| Range | 33.3% | 55.1% |
| Mean | 15.1% | 21.5% |
| Median | 13.8% | 18.6% |
| Interquartile 25% (IQ1) | 10.6% | 9.4% |
| Interquartile 75% (IQ3) | 17.8% | 30.5% |
| Interquartile Range (IQR) | 7.2% | 21.1% |
| Standard Deviation (Sample) | 7.4% | 13.7% |
| Standard Deviation (Population) | 7.3% | 13.6% |
Similar Demographics by Male Poverty
Demographics Similar to Mexican American Indians by Male Poverty
In terms of male poverty, the demographic groups most similar to Mexican American Indians are Immigrants from Liberia (13.0%, a difference of 0.090%), Immigrants from Burma/Myanmar (13.0%, a difference of 0.29%), Immigrants from Ghana (12.9%, a difference of 0.39%), Immigrants from Ecuador (12.9%, a difference of 0.44%), and Immigrants from Cuba (12.9%, a difference of 0.47%).
| Demographics | Rating | Rank | Male Poverty |
| Immigrants | Western Africa | 0.2 /100 | #247 | Tragic 12.9% |
| Immigrants | Sudan | 0.2 /100 | #248 | Tragic 12.9% |
| Potawatomi | 0.2 /100 | #249 | Tragic 12.9% |
| Immigrants | Nicaragua | 0.2 /100 | #250 | Tragic 12.9% |
| Immigrants | Cuba | 0.2 /100 | #251 | Tragic 12.9% |
| Immigrants | Ecuador | 0.2 /100 | #252 | Tragic 12.9% |
| Immigrants | Ghana | 0.2 /100 | #253 | Tragic 12.9% |
| Mexican American Indians | 0.1 /100 | #254 | Tragic 13.0% |
| Immigrants | Liberia | 0.1 /100 | #255 | Tragic 13.0% |
| Immigrants | Burma/Myanmar | 0.1 /100 | #256 | Tragic 13.0% |
| Immigrants | Trinidad and Tobago | 0.1 /100 | #257 | Tragic 13.1% |
| Cape Verdeans | 0.1 /100 | #258 | Tragic 13.1% |
| Cherokee | 0.1 /100 | #259 | Tragic 13.1% |
| Ottawa | 0.1 /100 | #260 | Tragic 13.1% |
| Trinidadians and Tobagonians | 0.1 /100 | #261 | Tragic 13.1% |
Demographics Similar to Yup'ik by Male Poverty
In terms of male poverty, the demographic groups most similar to Yup'ik are Pima (20.4%, a difference of 0.10%), Lumbee (20.2%, a difference of 0.88%), Immigrants from Yemen (20.1%, a difference of 1.2%), Hopi (20.8%, a difference of 2.1%), and Yuman (19.5%, a difference of 4.3%).
| Demographics | Rating | Rank | Male Poverty |
| Natives/Alaskans | 0.0 /100 | #333 | Tragic 16.9% |
| Cheyenne | 0.0 /100 | #334 | Tragic 17.6% |
| Apache | 0.0 /100 | #335 | Tragic 17.7% |
| Pueblo | 0.0 /100 | #336 | Tragic 18.5% |
| Sioux | 0.0 /100 | #337 | Tragic 18.7% |
| Crow | 0.0 /100 | #338 | Tragic 19.1% |
| Yuman | 0.0 /100 | #339 | Tragic 19.5% |
| Immigrants | Yemen | 0.0 /100 | #340 | Tragic 20.1% |
| Lumbee | 0.0 /100 | #341 | Tragic 20.2% |
| Pima | 0.0 /100 | #342 | Tragic 20.4% |
| Yup'ik | 0.0 /100 | #343 | Tragic 20.4% |
| Hopi | 0.0 /100 | #344 | Tragic 20.8% |
| Puerto Ricans | 0.0 /100 | #345 | Tragic 22.0% |
| Navajo | 0.0 /100 | #346 | Tragic 22.3% |
| Tohono O'odham | 0.0 /100 | #347 | Tragic 22.9% |