Icelander vs Egyptian Male Poverty
COMPARE
Icelander
Egyptian
Male Poverty
Male Poverty Comparison
Icelanders
Egyptians
11.0%
MALE POVERTY
68.5/ 100
METRIC RATING
147th/ 347
METRIC RANK
10.3%
MALE POVERTY
95.9/ 100
METRIC RATING
82nd/ 347
METRIC RANK
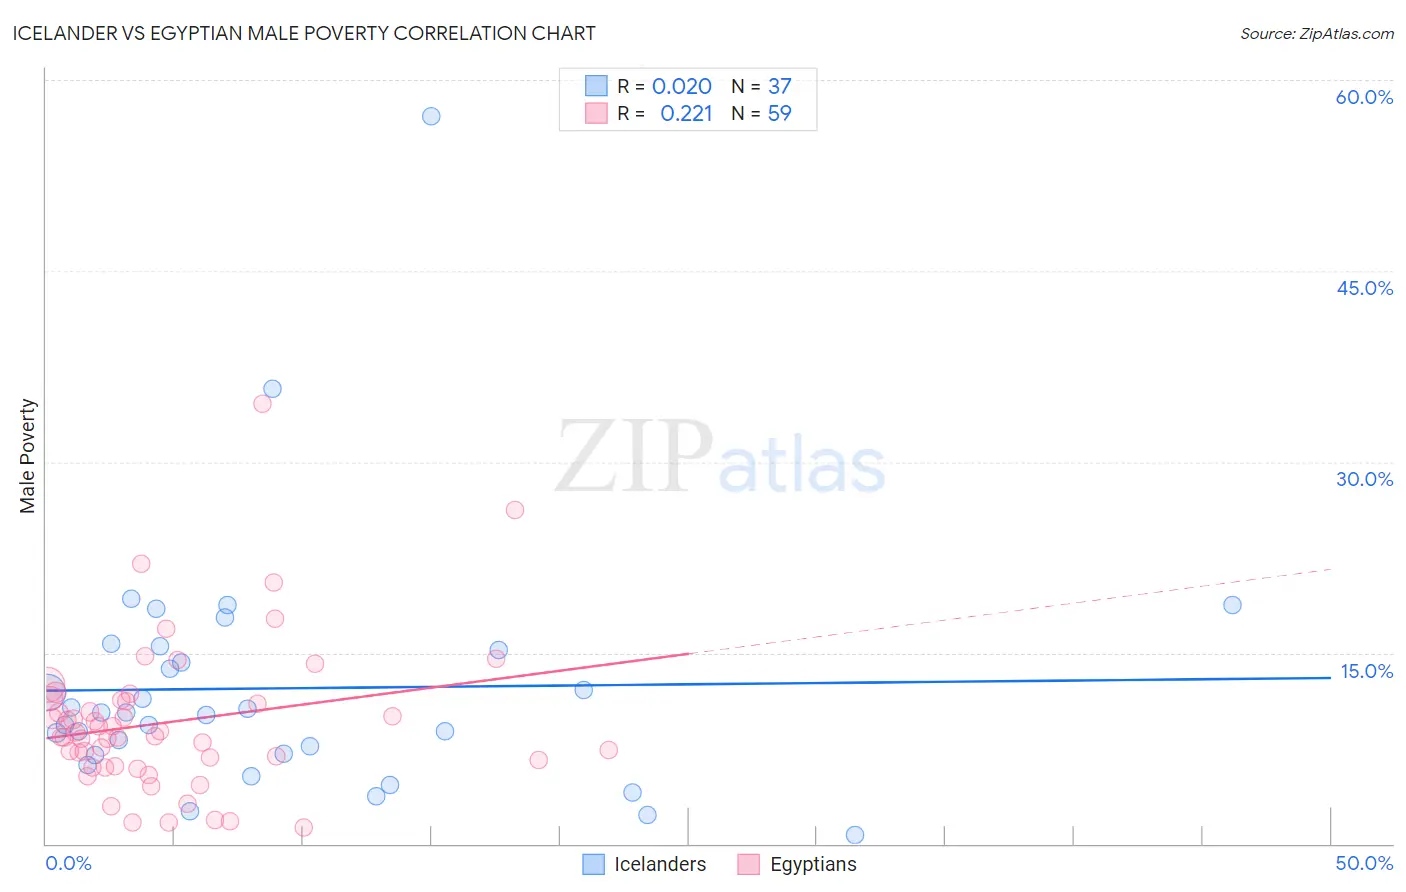
Icelander vs Egyptian Male Poverty Correlation Chart
The statistical analysis conducted on geographies consisting of 159,599,836 people shows no correlation between the proportion of Icelanders and poverty level among males in the United States with a correlation coefficient (R) of 0.020 and weighted average of 11.0%. Similarly, the statistical analysis conducted on geographies consisting of 276,705,416 people shows a weak positive correlation between the proportion of Egyptians and poverty level among males in the United States with a correlation coefficient (R) of 0.221 and weighted average of 10.3%, a difference of 6.3%.
Male Poverty Correlation Summary
| Measurement | Icelander | Egyptian |
| Minimum | 0.64% | 1.2% |
| Maximum | 57.1% | 34.6% |
| Range | 56.5% | 33.4% |
| Mean | 12.2% | 9.6% |
| Median | 10.3% | 8.4% |
| Interquartile 25% (IQ1) | 7.0% | 6.1% |
| Interquartile 75% (IQ3) | 15.4% | 11.3% |
| Interquartile Range (IQR) | 8.3% | 5.2% |
| Standard Deviation (Sample) | 10.0% | 5.9% |
| Standard Deviation (Population) | 9.8% | 5.9% |
Similar Demographics by Male Poverty
Demographics Similar to Icelanders by Male Poverty
In terms of male poverty, the demographic groups most similar to Icelanders are Armenian (11.0%, a difference of 0.050%), Immigrants from Venezuela (11.0%, a difference of 0.070%), Guamanian/Chamorro (11.0%, a difference of 0.11%), Venezuelan (11.0%, a difference of 0.13%), and Immigrants from Nepal (11.0%, a difference of 0.14%).
| Demographics | Rating | Rank | Male Poverty |
| Tlingit-Haida | 76.1 /100 | #140 | Good 10.9% |
| Immigrants | France | 75.8 /100 | #141 | Good 10.9% |
| Basques | 74.6 /100 | #142 | Good 10.9% |
| Afghans | 71.9 /100 | #143 | Good 10.9% |
| Samoans | 71.8 /100 | #144 | Good 10.9% |
| Immigrants | Germany | 71.6 /100 | #145 | Good 10.9% |
| Syrians | 71.4 /100 | #146 | Good 10.9% |
| Icelanders | 68.5 /100 | #147 | Good 11.0% |
| Armenians | 68.0 /100 | #148 | Good 11.0% |
| Immigrants | Venezuela | 67.9 /100 | #149 | Good 11.0% |
| Guamanians/Chamorros | 67.6 /100 | #150 | Good 11.0% |
| Venezuelans | 67.4 /100 | #151 | Good 11.0% |
| Immigrants | Nepal | 67.3 /100 | #152 | Good 11.0% |
| Immigrants | Bosnia and Herzegovina | 65.2 /100 | #153 | Good 11.0% |
| Immigrants | Kazakhstan | 64.8 /100 | #154 | Good 11.0% |
Demographics Similar to Egyptians by Male Poverty
In terms of male poverty, the demographic groups most similar to Egyptians are Belgian (10.3%, a difference of 0.0%), Immigrants from Sweden (10.3%, a difference of 0.12%), Czechoslovakian (10.3%, a difference of 0.19%), Immigrants from England (10.4%, a difference of 0.23%), and Immigrants from Eastern Asia (10.4%, a difference of 0.37%).
| Demographics | Rating | Rank | Male Poverty |
| Carpatho Rusyns | 96.9 /100 | #75 | Exceptional 10.2% |
| Dutch | 96.9 /100 | #76 | Exceptional 10.2% |
| Immigrants | Belgium | 96.8 /100 | #77 | Exceptional 10.3% |
| Irish | 96.8 /100 | #78 | Exceptional 10.3% |
| Immigrants | North America | 96.5 /100 | #79 | Exceptional 10.3% |
| English | 96.4 /100 | #80 | Exceptional 10.3% |
| Belgians | 95.9 /100 | #81 | Exceptional 10.3% |
| Egyptians | 95.9 /100 | #82 | Exceptional 10.3% |
| Immigrants | Sweden | 95.7 /100 | #83 | Exceptional 10.3% |
| Czechoslovakians | 95.6 /100 | #84 | Exceptional 10.3% |
| Immigrants | England | 95.5 /100 | #85 | Exceptional 10.4% |
| Immigrants | Eastern Asia | 95.3 /100 | #86 | Exceptional 10.4% |
| Northern Europeans | 95.2 /100 | #87 | Exceptional 10.4% |
| Cambodians | 95.0 /100 | #88 | Exceptional 10.4% |
| Immigrants | Denmark | 95.0 /100 | #89 | Exceptional 10.4% |