Icelander vs Salvadoran Male Poverty
COMPARE
Icelander
Salvadoran
Male Poverty
Male Poverty Comparison
Icelanders
Salvadorans
11.0%
MALE POVERTY
68.5/ 100
METRIC RATING
147th/ 347
METRIC RANK
12.6%
MALE POVERTY
0.6/ 100
METRIC RATING
231st/ 347
METRIC RANK
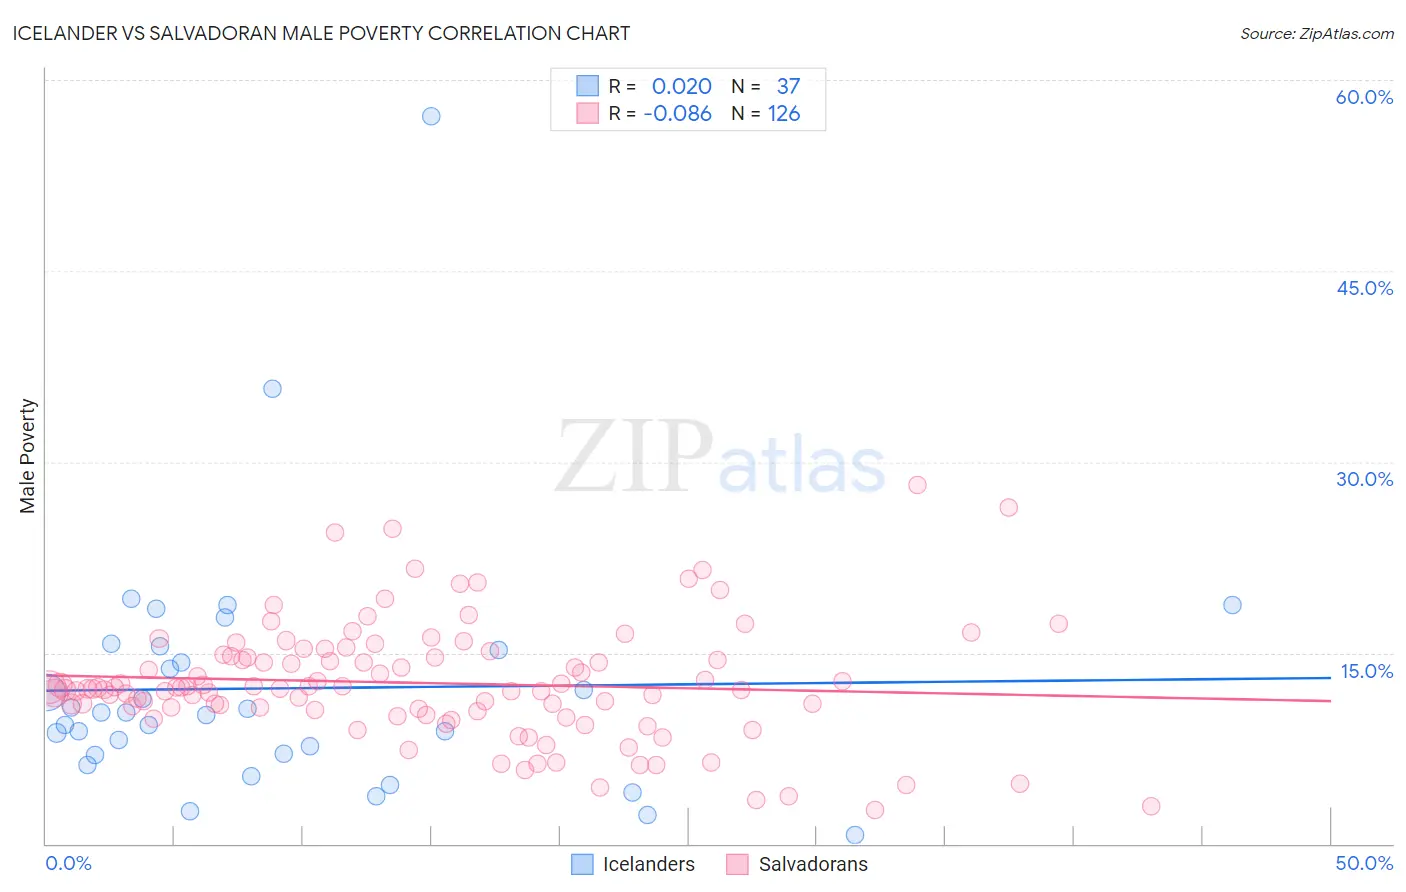
Icelander vs Salvadoran Male Poverty Correlation Chart
The statistical analysis conducted on geographies consisting of 159,599,836 people shows no correlation between the proportion of Icelanders and poverty level among males in the United States with a correlation coefficient (R) of 0.020 and weighted average of 11.0%. Similarly, the statistical analysis conducted on geographies consisting of 398,602,565 people shows a slight negative correlation between the proportion of Salvadorans and poverty level among males in the United States with a correlation coefficient (R) of -0.086 and weighted average of 12.6%, a difference of 14.5%.
Male Poverty Correlation Summary
| Measurement | Icelander | Salvadoran |
| Minimum | 0.64% | 2.6% |
| Maximum | 57.1% | 28.2% |
| Range | 56.5% | 25.5% |
| Mean | 12.2% | 12.6% |
| Median | 10.3% | 12.2% |
| Interquartile 25% (IQ1) | 7.0% | 10.5% |
| Interquartile 75% (IQ3) | 15.4% | 14.7% |
| Interquartile Range (IQR) | 8.3% | 4.2% |
| Standard Deviation (Sample) | 10.0% | 4.6% |
| Standard Deviation (Population) | 9.8% | 4.6% |
Similar Demographics by Male Poverty
Demographics Similar to Icelanders by Male Poverty
In terms of male poverty, the demographic groups most similar to Icelanders are Armenian (11.0%, a difference of 0.050%), Immigrants from Venezuela (11.0%, a difference of 0.070%), Guamanian/Chamorro (11.0%, a difference of 0.11%), Venezuelan (11.0%, a difference of 0.13%), and Immigrants from Nepal (11.0%, a difference of 0.14%).
| Demographics | Rating | Rank | Male Poverty |
| Tlingit-Haida | 76.1 /100 | #140 | Good 10.9% |
| Immigrants | France | 75.8 /100 | #141 | Good 10.9% |
| Basques | 74.6 /100 | #142 | Good 10.9% |
| Afghans | 71.9 /100 | #143 | Good 10.9% |
| Samoans | 71.8 /100 | #144 | Good 10.9% |
| Immigrants | Germany | 71.6 /100 | #145 | Good 10.9% |
| Syrians | 71.4 /100 | #146 | Good 10.9% |
| Icelanders | 68.5 /100 | #147 | Good 11.0% |
| Armenians | 68.0 /100 | #148 | Good 11.0% |
| Immigrants | Venezuela | 67.9 /100 | #149 | Good 11.0% |
| Guamanians/Chamorros | 67.6 /100 | #150 | Good 11.0% |
| Venezuelans | 67.4 /100 | #151 | Good 11.0% |
| Immigrants | Nepal | 67.3 /100 | #152 | Good 11.0% |
| Immigrants | Bosnia and Herzegovina | 65.2 /100 | #153 | Good 11.0% |
| Immigrants | Kazakhstan | 64.8 /100 | #154 | Good 11.0% |
Demographics Similar to Salvadorans by Male Poverty
In terms of male poverty, the demographic groups most similar to Salvadorans are Nicaraguan (12.6%, a difference of 0.12%), Fijian (12.6%, a difference of 0.16%), Immigrants from Armenia (12.6%, a difference of 0.23%), Marshallese (12.5%, a difference of 0.56%), and Immigrants from Laos (12.6%, a difference of 0.59%).
| Demographics | Rating | Rank | Male Poverty |
| Immigrants | Nigeria | 1.6 /100 | #224 | Tragic 12.3% |
| Osage | 1.5 /100 | #225 | Tragic 12.3% |
| Nigerians | 1.4 /100 | #226 | Tragic 12.3% |
| Alaska Natives | 1.4 /100 | #227 | Tragic 12.4% |
| Alsatians | 1.3 /100 | #228 | Tragic 12.4% |
| Cubans | 1.3 /100 | #229 | Tragic 12.4% |
| Marshallese | 0.8 /100 | #230 | Tragic 12.5% |
| Salvadorans | 0.6 /100 | #231 | Tragic 12.6% |
| Nicaraguans | 0.6 /100 | #232 | Tragic 12.6% |
| Fijians | 0.6 /100 | #233 | Tragic 12.6% |
| Immigrants | Armenia | 0.6 /100 | #234 | Tragic 12.6% |
| Immigrants | Laos | 0.5 /100 | #235 | Tragic 12.6% |
| Immigrants | Saudi Arabia | 0.4 /100 | #236 | Tragic 12.7% |
| French American Indians | 0.4 /100 | #237 | Tragic 12.7% |
| Ecuadorians | 0.4 /100 | #238 | Tragic 12.7% |