Icelander vs South American Male Poverty
COMPARE
Icelander
South American
Male Poverty
Male Poverty Comparison
Icelanders
South Americans
11.0%
MALE POVERTY
68.5/ 100
METRIC RATING
147th/ 347
METRIC RANK
11.1%
MALE POVERTY
53.8/ 100
METRIC RATING
170th/ 347
METRIC RANK
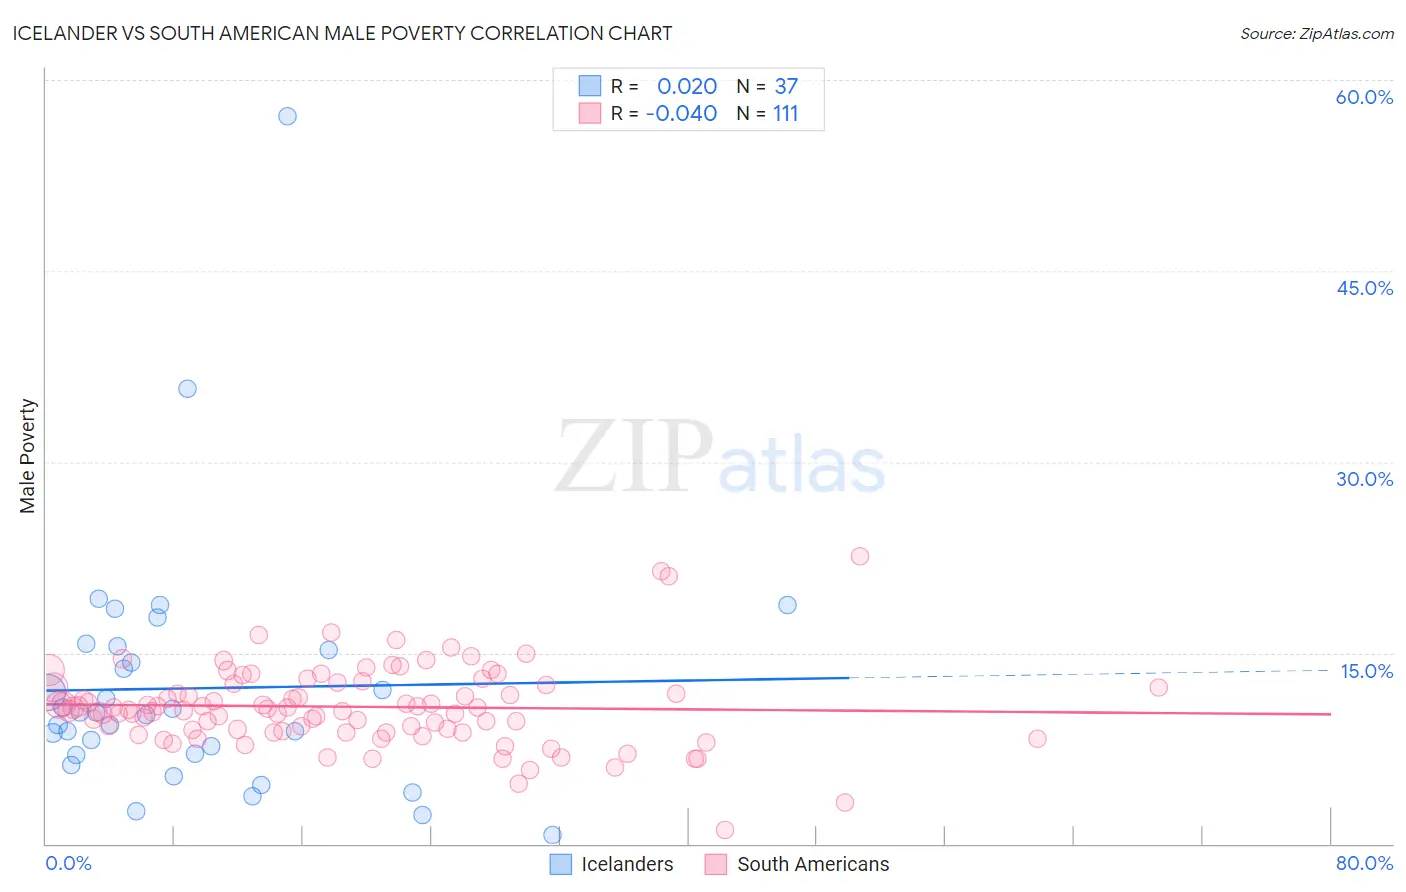
Icelander vs South American Male Poverty Correlation Chart
The statistical analysis conducted on geographies consisting of 159,599,836 people shows no correlation between the proportion of Icelanders and poverty level among males in the United States with a correlation coefficient (R) of 0.020 and weighted average of 11.0%. Similarly, the statistical analysis conducted on geographies consisting of 493,234,153 people shows no correlation between the proportion of South Americans and poverty level among males in the United States with a correlation coefficient (R) of -0.040 and weighted average of 11.1%, a difference of 1.6%.
Male Poverty Correlation Summary
| Measurement | Icelander | South American |
| Minimum | 0.64% | 1.0% |
| Maximum | 57.1% | 22.6% |
| Range | 56.5% | 21.6% |
| Mean | 12.2% | 10.8% |
| Median | 10.3% | 10.6% |
| Interquartile 25% (IQ1) | 7.0% | 8.9% |
| Interquartile 75% (IQ3) | 15.4% | 12.5% |
| Interquartile Range (IQR) | 8.3% | 3.6% |
| Standard Deviation (Sample) | 10.0% | 3.2% |
| Standard Deviation (Population) | 9.8% | 3.2% |
Similar Demographics by Male Poverty
Demographics Similar to Icelanders by Male Poverty
In terms of male poverty, the demographic groups most similar to Icelanders are Armenian (11.0%, a difference of 0.050%), Immigrants from Venezuela (11.0%, a difference of 0.070%), Guamanian/Chamorro (11.0%, a difference of 0.11%), Venezuelan (11.0%, a difference of 0.13%), and Immigrants from Nepal (11.0%, a difference of 0.14%).
| Demographics | Rating | Rank | Male Poverty |
| Tlingit-Haida | 76.1 /100 | #140 | Good 10.9% |
| Immigrants | France | 75.8 /100 | #141 | Good 10.9% |
| Basques | 74.6 /100 | #142 | Good 10.9% |
| Afghans | 71.9 /100 | #143 | Good 10.9% |
| Samoans | 71.8 /100 | #144 | Good 10.9% |
| Immigrants | Germany | 71.6 /100 | #145 | Good 10.9% |
| Syrians | 71.4 /100 | #146 | Good 10.9% |
| Icelanders | 68.5 /100 | #147 | Good 11.0% |
| Armenians | 68.0 /100 | #148 | Good 11.0% |
| Immigrants | Venezuela | 67.9 /100 | #149 | Good 11.0% |
| Guamanians/Chamorros | 67.6 /100 | #150 | Good 11.0% |
| Venezuelans | 67.4 /100 | #151 | Good 11.0% |
| Immigrants | Nepal | 67.3 /100 | #152 | Good 11.0% |
| Immigrants | Bosnia and Herzegovina | 65.2 /100 | #153 | Good 11.0% |
| Immigrants | Kazakhstan | 64.8 /100 | #154 | Good 11.0% |
Demographics Similar to South Americans by Male Poverty
In terms of male poverty, the demographic groups most similar to South Americans are Immigrants from Colombia (11.1%, a difference of 0.040%), Immigrants from Portugal (11.1%, a difference of 0.11%), Hungarian (11.1%, a difference of 0.14%), Immigrants from Albania (11.1%, a difference of 0.15%), and Immigrants from Spain (11.1%, a difference of 0.18%).
| Demographics | Rating | Rank | Male Poverty |
| Whites/Caucasians | 56.7 /100 | #163 | Average 11.1% |
| Ethiopians | 56.7 /100 | #164 | Average 11.1% |
| Immigrants | Spain | 55.5 /100 | #165 | Average 11.1% |
| Immigrants | Albania | 55.3 /100 | #166 | Average 11.1% |
| Hungarians | 55.1 /100 | #167 | Average 11.1% |
| Immigrants | Portugal | 54.9 /100 | #168 | Average 11.1% |
| Immigrants | Colombia | 54.2 /100 | #169 | Average 11.1% |
| South Americans | 53.8 /100 | #170 | Average 11.1% |
| Uruguayans | 51.0 /100 | #171 | Average 11.2% |
| Immigrants | Ethiopia | 50.7 /100 | #172 | Average 11.2% |
| Pennsylvania Germans | 50.5 /100 | #173 | Average 11.2% |
| Immigrants | Oceania | 50.0 /100 | #174 | Average 11.2% |
| Celtics | 47.5 /100 | #175 | Average 11.2% |
| Immigrants | Fiji | 46.0 /100 | #176 | Average 11.2% |
| Lebanese | 45.6 /100 | #177 | Average 11.2% |