Icelander vs Uruguayan Child Poverty Among Girls Under 16
COMPARE
Icelander
Uruguayan
Child Poverty Among Girls Under 16
Child Poverty Among Girls Under 16 Comparison
Icelanders
Uruguayans
15.7%
CHILD POVERTY AMONG GIRLS UNDER 16
82.4/ 100
METRIC RATING
148th/ 347
METRIC RANK
16.2%
CHILD POVERTY AMONG GIRLS UNDER 16
64.7/ 100
METRIC RATING
167th/ 347
METRIC RANK
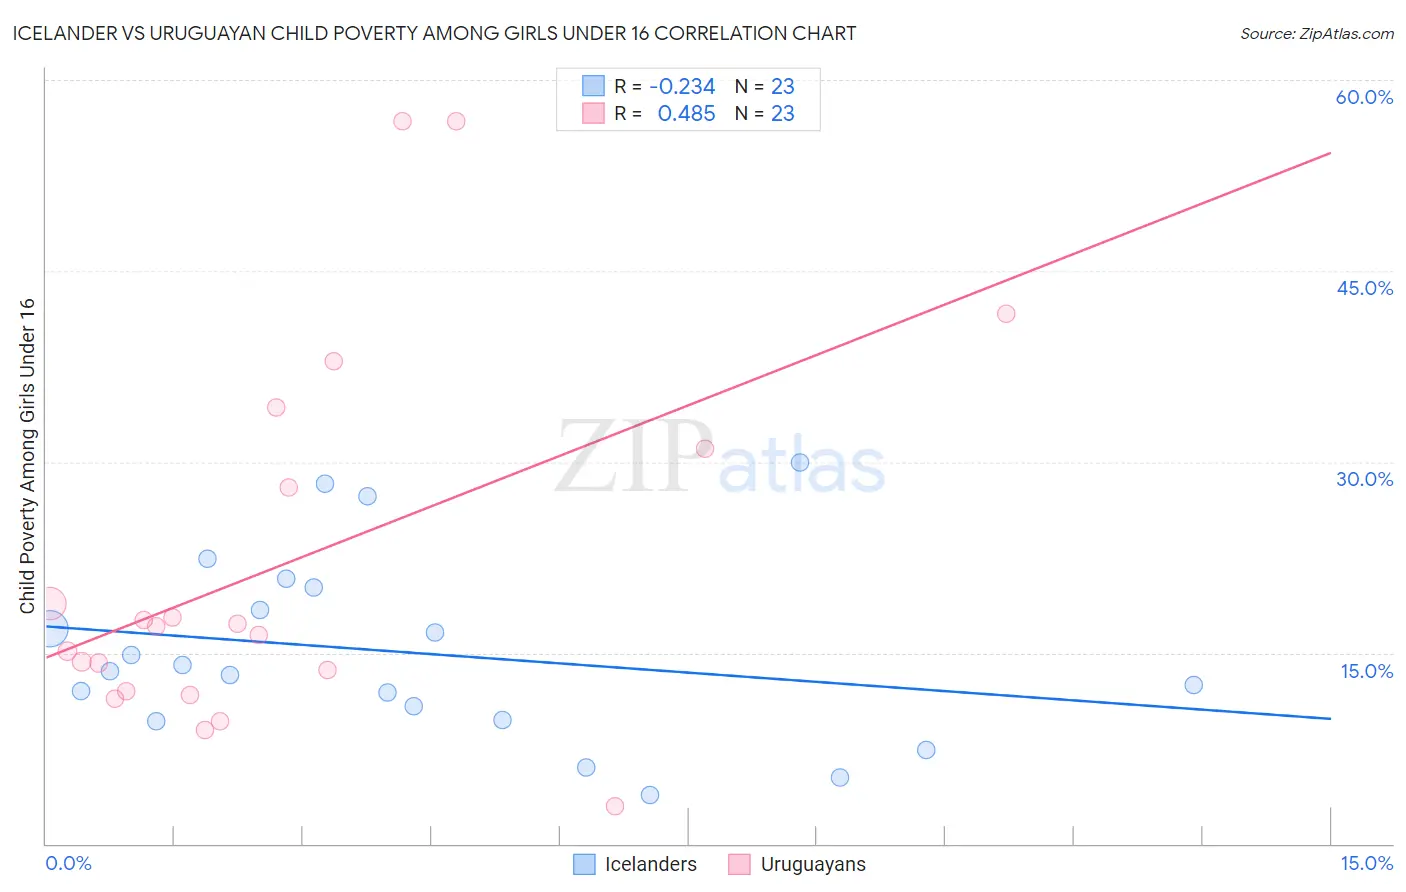
Icelander vs Uruguayan Child Poverty Among Girls Under 16 Correlation Chart
The statistical analysis conducted on geographies consisting of 158,122,044 people shows a weak negative correlation between the proportion of Icelanders and poverty level among girls under the age of 16 in the United States with a correlation coefficient (R) of -0.234 and weighted average of 15.7%. Similarly, the statistical analysis conducted on geographies consisting of 143,695,709 people shows a moderate positive correlation between the proportion of Uruguayans and poverty level among girls under the age of 16 in the United States with a correlation coefficient (R) of 0.485 and weighted average of 16.2%, a difference of 2.8%.
Child Poverty Among Girls Under 16 Correlation Summary
| Measurement | Icelander | Uruguayan |
| Minimum | 3.8% | 3.0% |
| Maximum | 30.0% | 56.8% |
| Range | 26.2% | 53.8% |
| Mean | 15.0% | 22.0% |
| Median | 13.5% | 17.1% |
| Interquartile 25% (IQ1) | 9.7% | 11.9% |
| Interquartile 75% (IQ3) | 20.1% | 31.0% |
| Interquartile Range (IQR) | 10.4% | 19.1% |
| Standard Deviation (Sample) | 7.2% | 14.6% |
| Standard Deviation (Population) | 7.1% | 14.3% |
Demographics Similar to Icelanders and Uruguayans by Child Poverty Among Girls Under 16
In terms of child poverty among girls under 16, the demographic groups most similar to Icelanders are Slavic (15.7%, a difference of 0.15%), Immigrants from Hungary (15.8%, a difference of 0.32%), Immigrants from Albania (15.8%, a difference of 0.35%), Venezuelan (15.8%, a difference of 0.46%), and Immigrants from Kuwait (15.8%, a difference of 0.60%). Similarly, the demographic groups most similar to Uruguayans are South American (16.1%, a difference of 0.32%), Immigrants from Germany (16.1%, a difference of 0.34%), Immigrants from Colombia (16.1%, a difference of 0.41%), Immigrants from Oceania (16.1%, a difference of 0.48%), and French Canadian (16.1%, a difference of 0.53%).
| Demographics | Rating | Rank | Child Poverty Among Girls Under 16 |
| Slavs | 83.1 /100 | #147 | Excellent 15.7% |
| Icelanders | 82.4 /100 | #148 | Excellent 15.7% |
| Immigrants | Hungary | 80.9 /100 | #149 | Excellent 15.8% |
| Immigrants | Albania | 80.7 /100 | #150 | Excellent 15.8% |
| Venezuelans | 80.1 /100 | #151 | Excellent 15.8% |
| Immigrants | Kuwait | 79.4 /100 | #152 | Good 15.8% |
| Immigrants | Nepal | 78.5 /100 | #153 | Good 15.9% |
| Immigrants | Chile | 76.7 /100 | #154 | Good 15.9% |
| Syrians | 76.7 /100 | #155 | Good 15.9% |
| Immigrants | Fiji | 76.1 /100 | #156 | Good 15.9% |
| Colombians | 76.1 /100 | #157 | Good 15.9% |
| Guamanians/Chamorros | 75.3 /100 | #158 | Good 15.9% |
| Slovaks | 75.2 /100 | #159 | Good 15.9% |
| French | 72.8 /100 | #160 | Good 16.0% |
| Immigrants | Northern Africa | 72.0 /100 | #161 | Good 16.0% |
| French Canadians | 68.7 /100 | #162 | Good 16.1% |
| Immigrants | Oceania | 68.4 /100 | #163 | Good 16.1% |
| Immigrants | Colombia | 67.8 /100 | #164 | Good 16.1% |
| Immigrants | Germany | 67.3 /100 | #165 | Good 16.1% |
| South Americans | 67.2 /100 | #166 | Good 16.1% |
| Uruguayans | 64.7 /100 | #167 | Good 16.2% |