Icelander vs Uruguayan Median Household Income
COMPARE
Icelander
Uruguayan
Median Household Income
Median Household Income Comparison
Icelanders
Uruguayans
$85,797
MEDIAN HOUSEHOLD INCOME
61.0/ 100
METRIC RATING
168th/ 347
METRIC RANK
$84,691
MEDIAN HOUSEHOLD INCOME
43.5/ 100
METRIC RATING
182nd/ 347
METRIC RANK
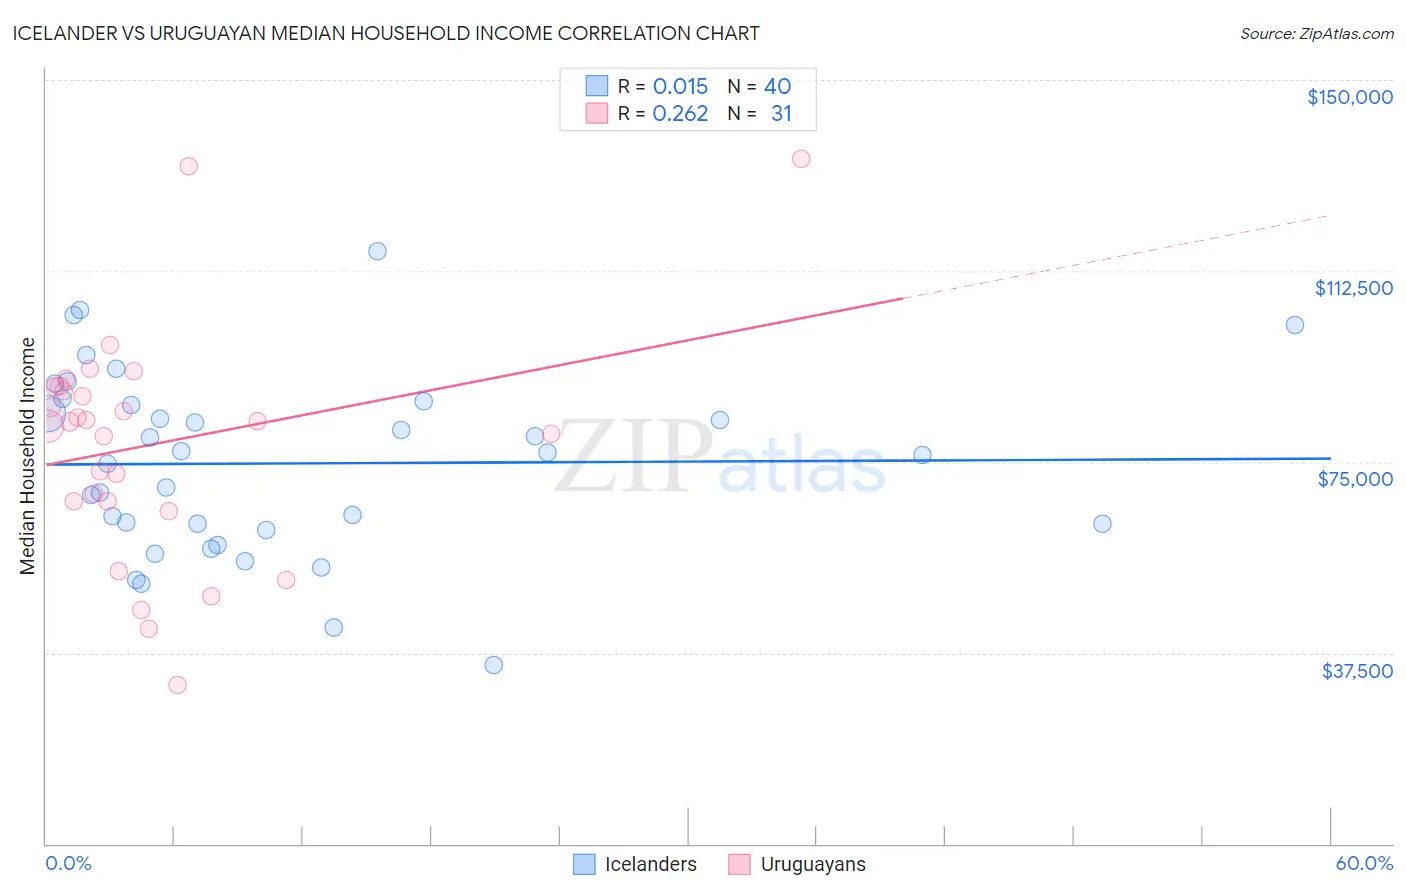
Icelander vs Uruguayan Median Household Income Correlation Chart
The statistical analysis conducted on geographies consisting of 159,599,934 people shows no correlation between the proportion of Icelanders and median household income in the United States with a correlation coefficient (R) of 0.015 and weighted average of $85,797. Similarly, the statistical analysis conducted on geographies consisting of 144,748,959 people shows a weak positive correlation between the proportion of Uruguayans and median household income in the United States with a correlation coefficient (R) of 0.262 and weighted average of $84,691, a difference of 1.3%.
Median Household Income Correlation Summary
| Measurement | Icelander | Uruguayan |
| Minimum | $35,179 | $31,250 |
| Maximum | $116,250 | $134,635 |
| Range | $81,071 | $103,385 |
| Mean | $74,702 | $78,489 |
| Median | $76,562 | $82,857 |
| Interquartile 25% (IQ1) | $62,204 | $67,190 |
| Interquartile 75% (IQ3) | $86,541 | $89,740 |
| Interquartile Range (IQR) | $24,337 | $22,550 |
| Standard Deviation (Sample) | $17,966 | $22,490 |
| Standard Deviation (Population) | $17,740 | $22,125 |
Demographics Similar to Icelanders and Uruguayans by Median Household Income
In terms of median household income, the demographic groups most similar to Icelanders are Immigrants ($85,818, a difference of 0.020%), Colombian ($85,716, a difference of 0.090%), Swiss ($85,681, a difference of 0.14%), Immigrants from South America ($85,611, a difference of 0.22%), and Slovene ($85,562, a difference of 0.27%). Similarly, the demographic groups most similar to Uruguayans are Hawaiian ($84,729, a difference of 0.040%), Immigrants from Portugal ($84,740, a difference of 0.060%), Spaniard ($84,644, a difference of 0.060%), English ($84,915, a difference of 0.26%), and Czechoslovakian ($84,965, a difference of 0.32%).
| Demographics | Rating | Rank | Median Household Income |
| Norwegians | 65.3 /100 | #165 | Good $86,084 |
| Scandinavians | 65.1 /100 | #166 | Good $86,073 |
| Immigrants | Immigrants | 61.3 /100 | #167 | Good $85,818 |
| Icelanders | 61.0 /100 | #168 | Good $85,797 |
| Colombians | 59.7 /100 | #169 | Average $85,716 |
| Swiss | 59.2 /100 | #170 | Average $85,681 |
| Immigrants | South America | 58.1 /100 | #171 | Average $85,611 |
| Slovenes | 57.4 /100 | #172 | Average $85,562 |
| Immigrants | Cameroon | 53.4 /100 | #173 | Average $85,314 |
| Scottish | 50.0 /100 | #174 | Average $85,101 |
| Immigrants | Costa Rica | 49.2 /100 | #175 | Average $85,054 |
| Alsatians | 49.2 /100 | #176 | Average $85,053 |
| Immigrants | Eritrea | 48.8 /100 | #177 | Average $85,025 |
| Czechoslovakians | 47.8 /100 | #178 | Average $84,965 |
| English | 47.0 /100 | #179 | Average $84,915 |
| Immigrants | Portugal | 44.2 /100 | #180 | Average $84,740 |
| Hawaiians | 44.1 /100 | #181 | Average $84,729 |
| Uruguayans | 43.5 /100 | #182 | Average $84,691 |
| Spaniards | 42.7 /100 | #183 | Average $84,644 |
| Immigrants | Eastern Africa | 37.4 /100 | #184 | Fair $84,299 |
| Kenyans | 34.2 /100 | #185 | Fair $84,085 |