Pennsylvania German vs Uruguayan Single Male Poverty
COMPARE
Pennsylvania German
Uruguayan
Single Male Poverty
Single Male Poverty Comparison
Pennsylvania Germans
Uruguayans
15.6%
SINGLE MALE POVERTY
0.0/ 100
METRIC RATING
306th/ 347
METRIC RANK
11.9%
SINGLE MALE POVERTY
99.4/ 100
METRIC RATING
75th/ 347
METRIC RANK
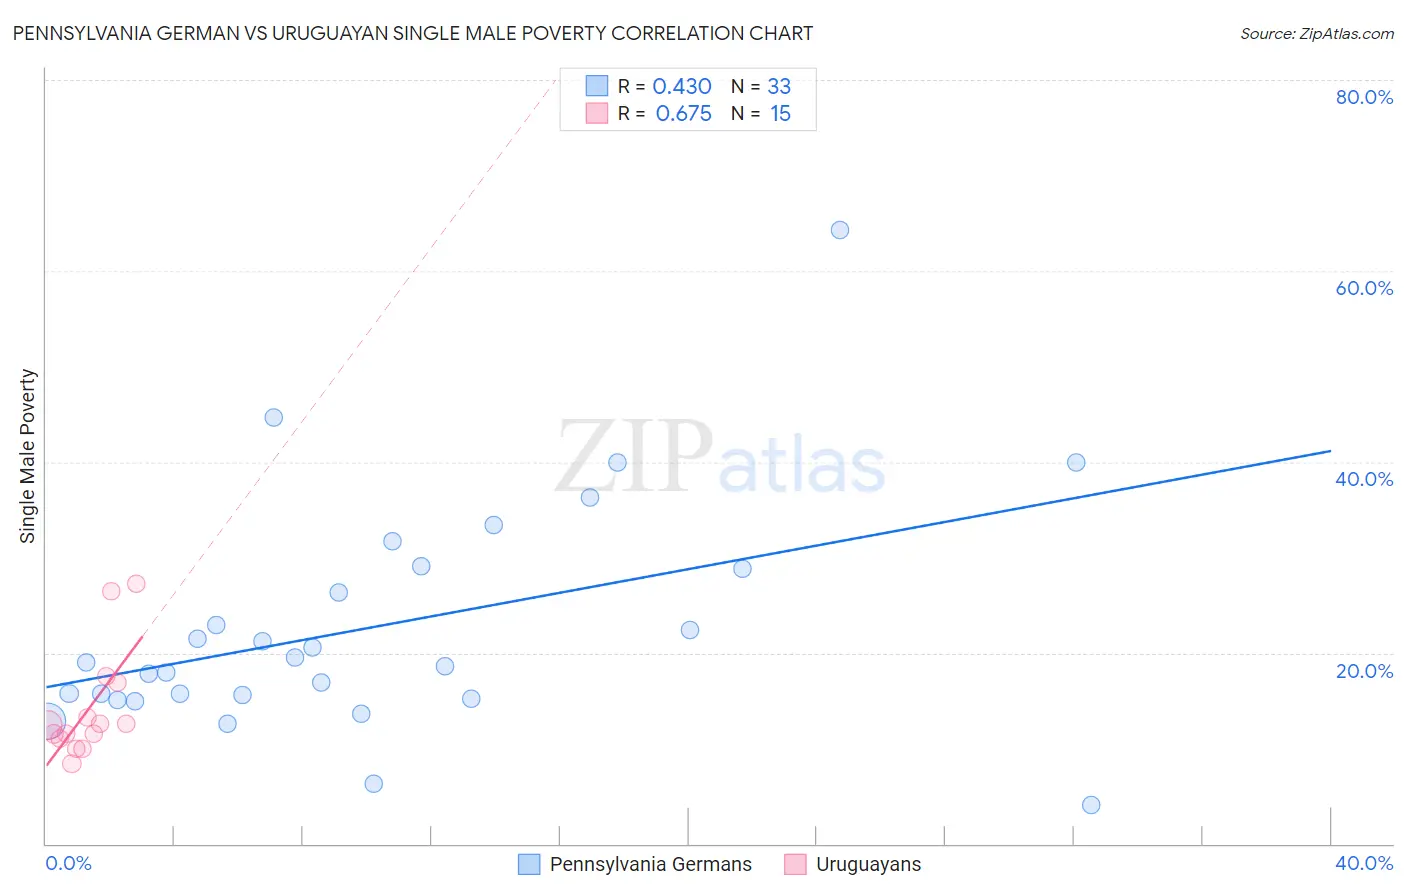
Pennsylvania German vs Uruguayan Single Male Poverty Correlation Chart
The statistical analysis conducted on geographies consisting of 211,597,863 people shows a moderate positive correlation between the proportion of Pennsylvania Germans and poverty level among single males in the United States with a correlation coefficient (R) of 0.430 and weighted average of 15.6%. Similarly, the statistical analysis conducted on geographies consisting of 136,478,006 people shows a significant positive correlation between the proportion of Uruguayans and poverty level among single males in the United States with a correlation coefficient (R) of 0.675 and weighted average of 11.9%, a difference of 30.3%.
Single Male Poverty Correlation Summary
| Measurement | Pennsylvania German | Uruguayan |
| Minimum | 4.0% | 8.4% |
| Maximum | 64.3% | 27.3% |
| Range | 60.3% | 18.9% |
| Mean | 22.7% | 14.2% |
| Median | 19.0% | 12.4% |
| Interquartile 25% (IQ1) | 15.3% | 11.0% |
| Interquartile 75% (IQ3) | 29.0% | 16.9% |
| Interquartile Range (IQR) | 13.6% | 5.9% |
| Standard Deviation (Sample) | 12.1% | 5.7% |
| Standard Deviation (Population) | 11.9% | 5.5% |
Similar Demographics by Single Male Poverty
Demographics Similar to Pennsylvania Germans by Single Male Poverty
In terms of single male poverty, the demographic groups most similar to Pennsylvania Germans are Blackfeet (15.5%, a difference of 0.43%), Ute (15.7%, a difference of 0.75%), Alaska Native (15.4%, a difference of 0.96%), Aleut (15.4%, a difference of 1.1%), and Potawatomi (15.8%, a difference of 1.3%).
| Demographics | Rating | Rank | Single Male Poverty |
| Delaware | 0.0 /100 | #299 | Tragic 15.0% |
| Cree | 0.0 /100 | #300 | Tragic 15.1% |
| Dominicans | 0.0 /100 | #301 | Tragic 15.2% |
| Alsatians | 0.0 /100 | #302 | Tragic 15.2% |
| Aleuts | 0.0 /100 | #303 | Tragic 15.4% |
| Alaska Natives | 0.0 /100 | #304 | Tragic 15.4% |
| Blackfeet | 0.0 /100 | #305 | Tragic 15.5% |
| Pennsylvania Germans | 0.0 /100 | #306 | Tragic 15.6% |
| Ute | 0.0 /100 | #307 | Tragic 15.7% |
| Potawatomi | 0.0 /100 | #308 | Tragic 15.8% |
| Americans | 0.0 /100 | #309 | Tragic 15.8% |
| Yakama | 0.0 /100 | #310 | Tragic 15.9% |
| Seminole | 0.0 /100 | #311 | Tragic 16.0% |
| Comanche | 0.0 /100 | #312 | Tragic 16.0% |
| Cherokee | 0.0 /100 | #313 | Tragic 16.1% |
Demographics Similar to Uruguayans by Single Male Poverty
In terms of single male poverty, the demographic groups most similar to Uruguayans are Immigrants from Northern Africa (11.9%, a difference of 0.020%), Chilean (11.9%, a difference of 0.19%), Argentinean (11.9%, a difference of 0.25%), Immigrants from Malaysia (12.0%, a difference of 0.29%), and Immigrants from Argentina (11.9%, a difference of 0.37%).
| Demographics | Rating | Rank | Single Male Poverty |
| Immigrants | Croatia | 99.6 /100 | #68 | Exceptional 11.9% |
| Immigrants | Russia | 99.6 /100 | #69 | Exceptional 11.9% |
| Immigrants | Nepal | 99.6 /100 | #70 | Exceptional 11.9% |
| Immigrants | Greece | 99.6 /100 | #71 | Exceptional 11.9% |
| Immigrants | Argentina | 99.5 /100 | #72 | Exceptional 11.9% |
| Argentineans | 99.5 /100 | #73 | Exceptional 11.9% |
| Chileans | 99.5 /100 | #74 | Exceptional 11.9% |
| Uruguayans | 99.4 /100 | #75 | Exceptional 11.9% |
| Immigrants | Northern Africa | 99.4 /100 | #76 | Exceptional 11.9% |
| Immigrants | Malaysia | 99.2 /100 | #77 | Exceptional 12.0% |
| Immigrants | Venezuela | 99.1 /100 | #78 | Exceptional 12.0% |
| Immigrants | Belgium | 99.0 /100 | #79 | Exceptional 12.0% |
| Armenians | 98.7 /100 | #80 | Exceptional 12.1% |
| Immigrants | South America | 98.7 /100 | #81 | Exceptional 12.1% |
| Immigrants | Colombia | 98.6 /100 | #82 | Exceptional 12.1% |