Icelander vs Uruguayan Per Capita Income
COMPARE
Icelander
Uruguayan
Per Capita Income
Per Capita Income Comparison
Icelanders
Uruguayans
$44,987
PER CAPITA INCOME
81.6/ 100
METRIC RATING
144th/ 347
METRIC RANK
$44,318
PER CAPITA INCOME
67.6/ 100
METRIC RATING
155th/ 347
METRIC RANK
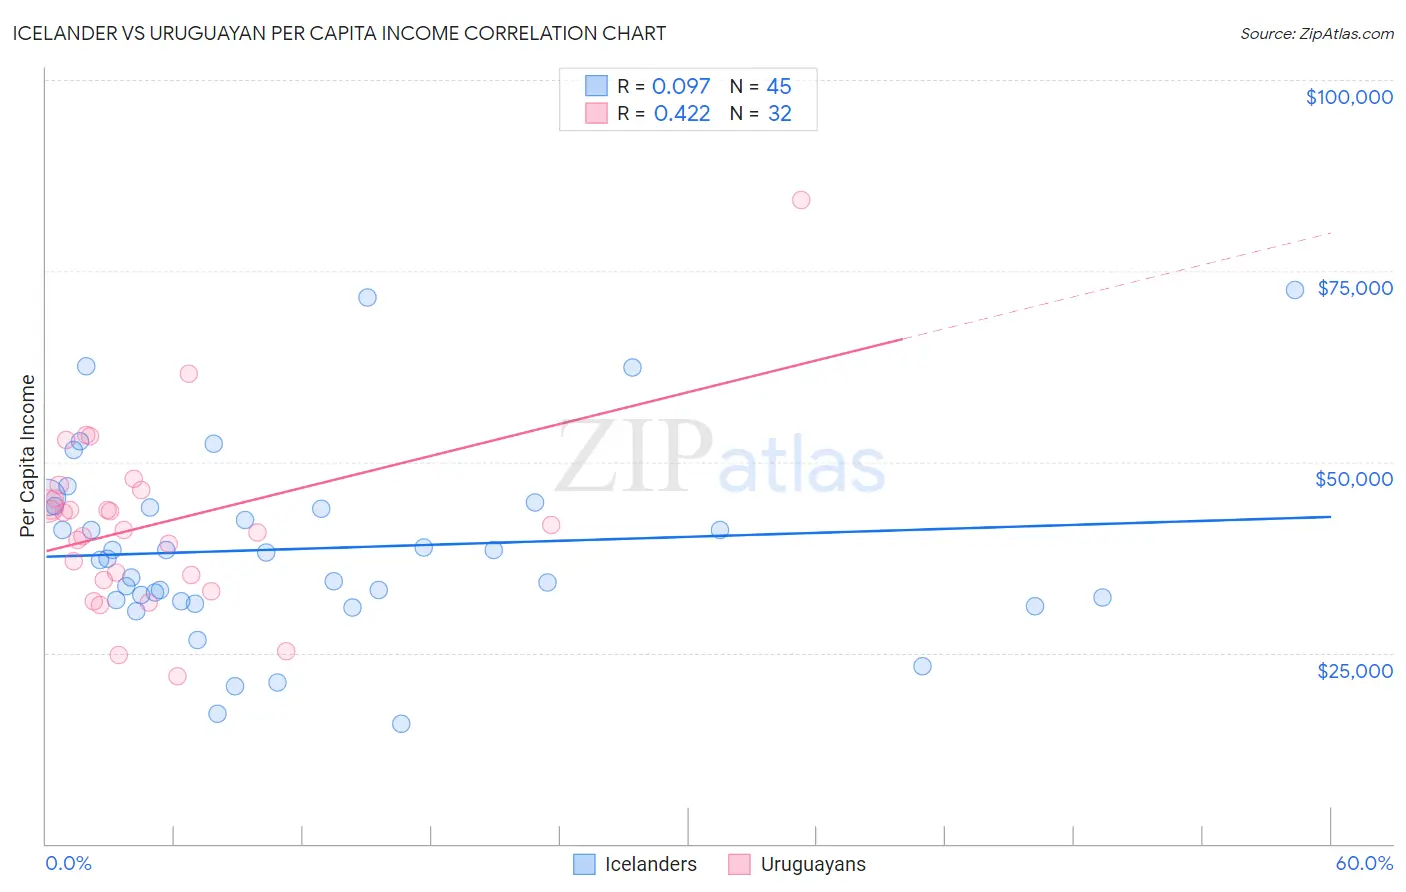
Icelander vs Uruguayan Per Capita Income Correlation Chart
The statistical analysis conducted on geographies consisting of 159,668,759 people shows a slight positive correlation between the proportion of Icelanders and per capita income in the United States with a correlation coefficient (R) of 0.097 and weighted average of $44,987. Similarly, the statistical analysis conducted on geographies consisting of 144,785,218 people shows a moderate positive correlation between the proportion of Uruguayans and per capita income in the United States with a correlation coefficient (R) of 0.422 and weighted average of $44,318, a difference of 1.5%.
Per Capita Income Correlation Summary
| Measurement | Icelander | Uruguayan |
| Minimum | $15,711 | $21,859 |
| Maximum | $72,483 | $84,313 |
| Range | $56,772 | $62,454 |
| Mean | $38,667 | $41,831 |
| Median | $37,248 | $41,436 |
| Interquartile 25% (IQ1) | $31,880 | $34,824 |
| Interquartile 75% (IQ3) | $44,123 | $45,774 |
| Interquartile Range (IQR) | $12,243 | $10,950 |
| Standard Deviation (Sample) | $12,398 | $11,692 |
| Standard Deviation (Population) | $12,260 | $11,508 |
Demographics Similar to Icelanders and Uruguayans by Per Capita Income
In terms of per capita income, the demographic groups most similar to Icelanders are Immigrants from Uganda ($45,043, a difference of 0.12%), Ugandan ($45,047, a difference of 0.13%), Slavic ($45,049, a difference of 0.14%), Immigrants from Jordan ($45,066, a difference of 0.18%), and Basque ($45,086, a difference of 0.22%). Similarly, the demographic groups most similar to Uruguayans are Portuguese ($44,362, a difference of 0.10%), Slovak ($44,229, a difference of 0.20%), South American Indian ($44,206, a difference of 0.25%), Scottish ($44,440, a difference of 0.27%), and Immigrants from Nepal ($44,187, a difference of 0.30%).
| Demographics | Rating | Rank | Per Capita Income |
| Basques | 83.2 /100 | #139 | Excellent $45,086 |
| Immigrants | Jordan | 82.9 /100 | #140 | Excellent $45,066 |
| Slavs | 82.6 /100 | #141 | Excellent $45,049 |
| Ugandans | 82.6 /100 | #142 | Excellent $45,047 |
| Immigrants | Uganda | 82.5 /100 | #143 | Excellent $45,043 |
| Icelanders | 81.6 /100 | #144 | Excellent $44,987 |
| Immigrants | Afghanistan | 78.0 /100 | #145 | Good $44,790 |
| Irish | 75.8 /100 | #146 | Good $44,679 |
| Czechs | 74.1 /100 | #147 | Good $44,595 |
| Immigrants | Armenia | 73.1 /100 | #148 | Good $44,552 |
| Koreans | 72.5 /100 | #149 | Good $44,522 |
| Immigrants | Eritrea | 72.1 /100 | #150 | Good $44,509 |
| Norwegians | 71.5 /100 | #151 | Good $44,480 |
| Peruvians | 71.5 /100 | #152 | Good $44,479 |
| Scottish | 70.6 /100 | #153 | Good $44,440 |
| Portuguese | 68.7 /100 | #154 | Good $44,362 |
| Uruguayans | 67.6 /100 | #155 | Good $44,318 |
| Slovaks | 65.4 /100 | #156 | Good $44,229 |
| South American Indians | 64.8 /100 | #157 | Good $44,206 |
| Immigrants | Nepal | 64.3 /100 | #158 | Good $44,187 |
| South Americans | 62.4 /100 | #159 | Good $44,114 |