Icelander vs Immigrants from Congo Child Poverty Under the Age of 5
COMPARE
Icelander
Immigrants from Congo
Child Poverty Under the Age of 5
Child Poverty Under the Age of 5 Comparison
Icelanders
Immigrants from Congo
16.3%
CHILD POVERTY UNDER THE AGE OF 5
87.9/ 100
METRIC RATING
133rd/ 347
METRIC RANK
23.9%
CHILD POVERTY UNDER THE AGE OF 5
0.0/ 100
METRIC RATING
325th/ 347
METRIC RANK
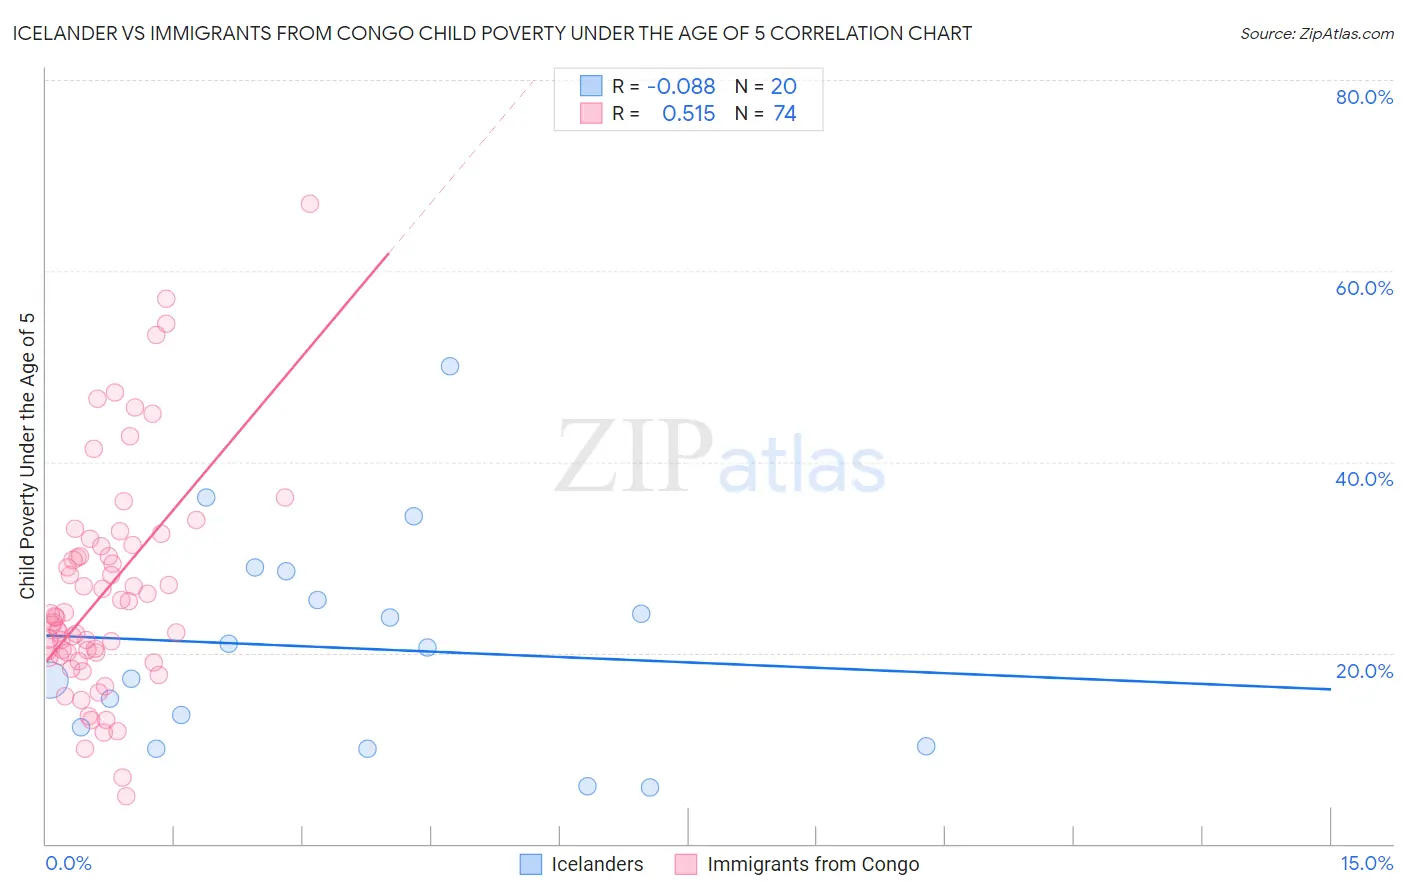
Icelander vs Immigrants from Congo Child Poverty Under the Age of 5 Correlation Chart
The statistical analysis conducted on geographies consisting of 155,974,196 people shows a slight negative correlation between the proportion of Icelanders and poverty level among children under the age of 5 in the United States with a correlation coefficient (R) of -0.088 and weighted average of 16.3%. Similarly, the statistical analysis conducted on geographies consisting of 91,481,308 people shows a substantial positive correlation between the proportion of Immigrants from Congo and poverty level among children under the age of 5 in the United States with a correlation coefficient (R) of 0.515 and weighted average of 23.9%, a difference of 46.1%.
Child Poverty Under the Age of 5 Correlation Summary
| Measurement | Icelander | Immigrants from Congo |
| Minimum | 5.9% | 5.0% |
| Maximum | 50.0% | 67.1% |
| Range | 44.1% | 62.1% |
| Mean | 20.5% | 26.4% |
| Median | 19.0% | 23.8% |
| Interquartile 25% (IQ1) | 11.2% | 19.7% |
| Interquartile 75% (IQ3) | 27.0% | 31.1% |
| Interquartile Range (IQR) | 15.8% | 11.4% |
| Standard Deviation (Sample) | 11.3% | 11.8% |
| Standard Deviation (Population) | 11.0% | 11.7% |
Similar Demographics by Child Poverty Under the Age of 5
Demographics Similar to Icelanders by Child Poverty Under the Age of 5
In terms of child poverty under the age of 5, the demographic groups most similar to Icelanders are Immigrants from North Macedonia (16.4%, a difference of 0.020%), Brazilian (16.4%, a difference of 0.030%), Serbian (16.3%, a difference of 0.070%), Immigrants from Northern Africa (16.4%, a difference of 0.090%), and Finnish (16.3%, a difference of 0.10%).
| Demographics | Rating | Rank | Child Poverty Under the Age of 5 |
| Immigrants | Albania | 91.8 /100 | #126 | Exceptional 16.2% |
| Immigrants | England | 91.5 /100 | #127 | Exceptional 16.2% |
| South Africans | 90.1 /100 | #128 | Exceptional 16.2% |
| British | 89.4 /100 | #129 | Excellent 16.3% |
| Immigrants | Norway | 89.3 /100 | #130 | Excellent 16.3% |
| Finns | 88.3 /100 | #131 | Excellent 16.3% |
| Serbians | 88.2 /100 | #132 | Excellent 16.3% |
| Icelanders | 87.9 /100 | #133 | Excellent 16.3% |
| Immigrants | North Macedonia | 87.8 /100 | #134 | Excellent 16.4% |
| Brazilians | 87.8 /100 | #135 | Excellent 16.4% |
| Immigrants | Northern Africa | 87.5 /100 | #136 | Excellent 16.4% |
| Immigrants | Chile | 85.3 /100 | #137 | Excellent 16.4% |
| Germans | 84.8 /100 | #138 | Excellent 16.5% |
| Immigrants | Hungary | 84.5 /100 | #139 | Excellent 16.5% |
| Guamanians/Chamorros | 84.2 /100 | #140 | Excellent 16.5% |
Demographics Similar to Immigrants from Congo by Child Poverty Under the Age of 5
In terms of child poverty under the age of 5, the demographic groups most similar to Immigrants from Congo are Central American Indian (23.9%, a difference of 0.18%), Paiute (23.8%, a difference of 0.21%), Dominican (24.0%, a difference of 0.64%), Immigrants from Dominican Republic (24.1%, a difference of 0.73%), and Pueblo (23.7%, a difference of 0.82%).
| Demographics | Rating | Rank | Child Poverty Under the Age of 5 |
| Dutch West Indians | 0.0 /100 | #318 | Tragic 23.3% |
| Chippewa | 0.0 /100 | #319 | Tragic 23.4% |
| Choctaw | 0.0 /100 | #320 | Tragic 23.5% |
| Immigrants | Honduras | 0.0 /100 | #321 | Tragic 23.5% |
| Ute | 0.0 /100 | #322 | Tragic 23.5% |
| Pueblo | 0.0 /100 | #323 | Tragic 23.7% |
| Paiute | 0.0 /100 | #324 | Tragic 23.8% |
| Immigrants | Congo | 0.0 /100 | #325 | Tragic 23.9% |
| Central American Indians | 0.0 /100 | #326 | Tragic 23.9% |
| Dominicans | 0.0 /100 | #327 | Tragic 24.0% |
| Immigrants | Dominican Republic | 0.0 /100 | #328 | Tragic 24.1% |
| Cajuns | 0.0 /100 | #329 | Tragic 24.1% |
| Creek | 0.0 /100 | #330 | Tragic 24.2% |
| Kiowa | 0.0 /100 | #331 | Tragic 24.5% |
| Apache | 0.0 /100 | #332 | Tragic 25.0% |