Hispanic or Latino vs Spanish American Single Male Poverty
COMPARE
Hispanic or Latino
Spanish American
Single Male Poverty
Single Male Poverty Comparison
Hispanics or Latinos
Spanish Americans
14.2%
SINGLE MALE POVERTY
0.0/ 100
METRIC RATING
281st/ 347
METRIC RANK
14.2%
SINGLE MALE POVERTY
0.0/ 100
METRIC RATING
282nd/ 347
METRIC RANK
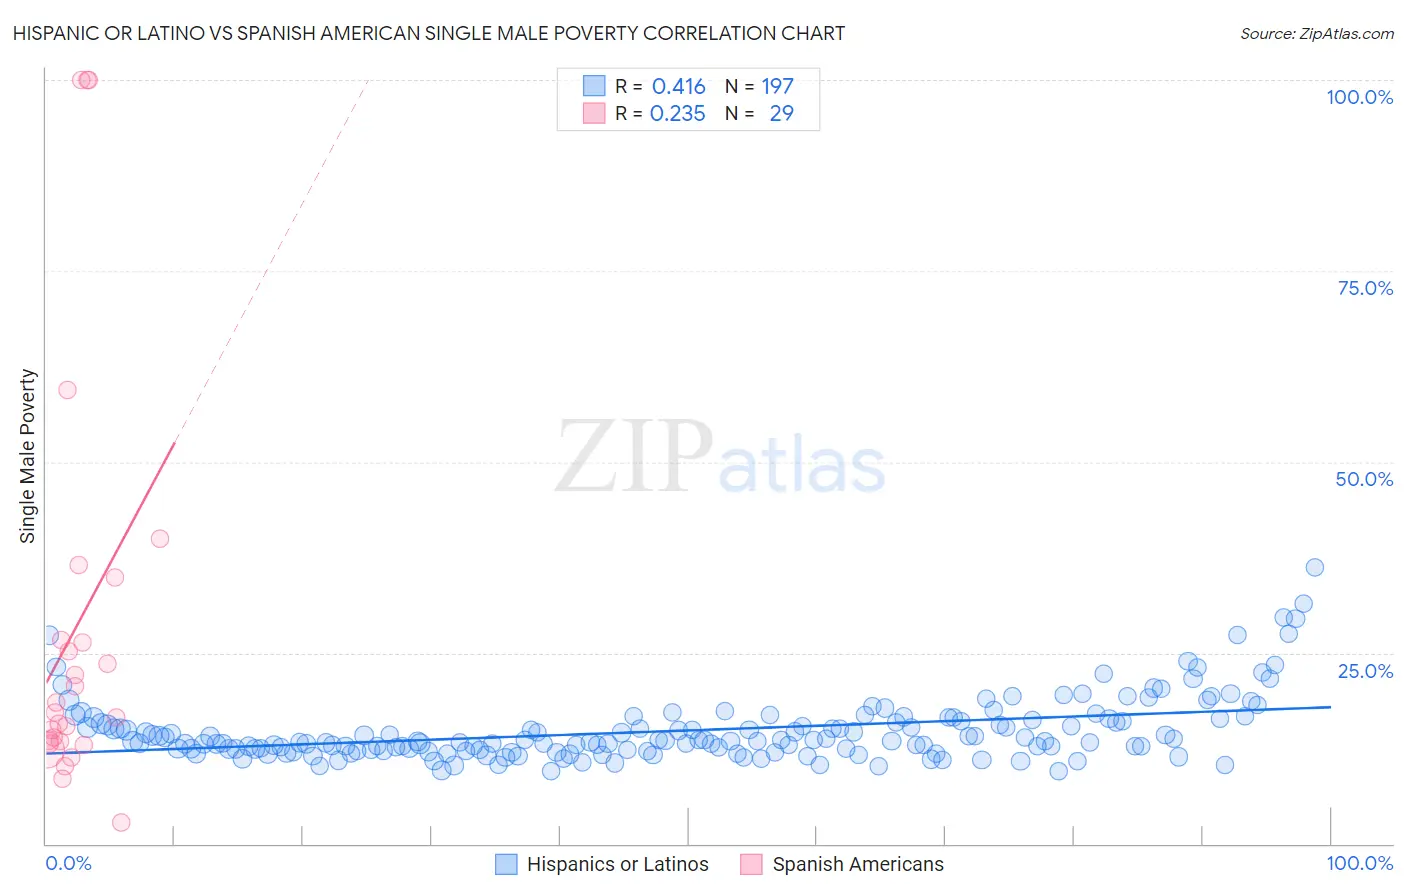
Hispanic or Latino vs Spanish American Single Male Poverty Correlation Chart
The statistical analysis conducted on geographies consisting of 473,841,382 people shows a moderate positive correlation between the proportion of Hispanics or Latinos and poverty level among single males in the United States with a correlation coefficient (R) of 0.416 and weighted average of 14.2%. Similarly, the statistical analysis conducted on geographies consisting of 100,269,530 people shows a weak positive correlation between the proportion of Spanish Americans and poverty level among single males in the United States with a correlation coefficient (R) of 0.235 and weighted average of 14.2%, a difference of 0.16%.
Single Male Poverty Correlation Summary
| Measurement | Hispanic or Latino | Spanish American |
| Minimum | 9.5% | 2.8% |
| Maximum | 36.1% | 100.0% |
| Range | 26.6% | 97.2% |
| Mean | 14.8% | 28.5% |
| Median | 13.5% | 17.2% |
| Interquartile 25% (IQ1) | 12.3% | 13.2% |
| Interquartile 75% (IQ3) | 16.2% | 30.7% |
| Interquartile Range (IQR) | 3.8% | 17.5% |
| Standard Deviation (Sample) | 4.2% | 27.2% |
| Standard Deviation (Population) | 4.2% | 26.7% |
Demographics Similar to Hispanics or Latinos and Spanish Americans by Single Male Poverty
In terms of single male poverty, the demographic groups most similar to Hispanics or Latinos are Hmong (14.2%, a difference of 0.030%), Yaqui (14.2%, a difference of 0.32%), Indonesian (14.1%, a difference of 0.73%), Slovak (14.1%, a difference of 0.77%), and Immigrants from Honduras (14.1%, a difference of 0.83%). Similarly, the demographic groups most similar to Spanish Americans are Yaqui (14.2%, a difference of 0.16%), Hmong (14.2%, a difference of 0.18%), Indonesian (14.1%, a difference of 0.89%), Slovak (14.1%, a difference of 0.93%), and Immigrants from Honduras (14.1%, a difference of 0.99%).
| Demographics | Rating | Rank | Single Male Poverty |
| Irish | 0.1 /100 | #271 | Tragic 14.0% |
| Mexicans | 0.1 /100 | #272 | Tragic 14.0% |
| Welsh | 0.1 /100 | #273 | Tragic 14.0% |
| Hondurans | 0.1 /100 | #274 | Tragic 14.0% |
| English | 0.1 /100 | #275 | Tragic 14.1% |
| Dutch | 0.1 /100 | #276 | Tragic 14.1% |
| Immigrants | Honduras | 0.0 /100 | #277 | Tragic 14.1% |
| Slovaks | 0.0 /100 | #278 | Tragic 14.1% |
| Indonesians | 0.0 /100 | #279 | Tragic 14.1% |
| Hmong | 0.0 /100 | #280 | Tragic 14.2% |
| Hispanics or Latinos | 0.0 /100 | #281 | Tragic 14.2% |
| Spanish Americans | 0.0 /100 | #282 | Tragic 14.2% |
| Yaqui | 0.0 /100 | #283 | Tragic 14.2% |
| Immigrants | Bahamas | 0.0 /100 | #284 | Tragic 14.4% |
| French | 0.0 /100 | #285 | Tragic 14.4% |
| Celtics | 0.0 /100 | #286 | Tragic 14.5% |
| Iroquois | 0.0 /100 | #287 | Tragic 14.5% |
| Whites/Caucasians | 0.0 /100 | #288 | Tragic 14.5% |
| Immigrants | Dominica | 0.0 /100 | #289 | Tragic 14.5% |
| U.S. Virgin Islanders | 0.0 /100 | #290 | Tragic 14.5% |
| Bahamians | 0.0 /100 | #291 | Tragic 14.6% |