Hawaiian vs Arapaho Married-Couple Family Poverty
COMPARE
Hawaiian
Arapaho
Married-Couple Family Poverty
Married-Couple Family Poverty Comparison
Hawaiians
Arapaho
5.1%
MARRIED-COUPLE FAMILY POVERTY
62.3/ 100
METRIC RATING
164th/ 347
METRIC RANK
6.6%
MARRIED-COUPLE FAMILY POVERTY
0.0/ 100
METRIC RATING
293rd/ 347
METRIC RANK
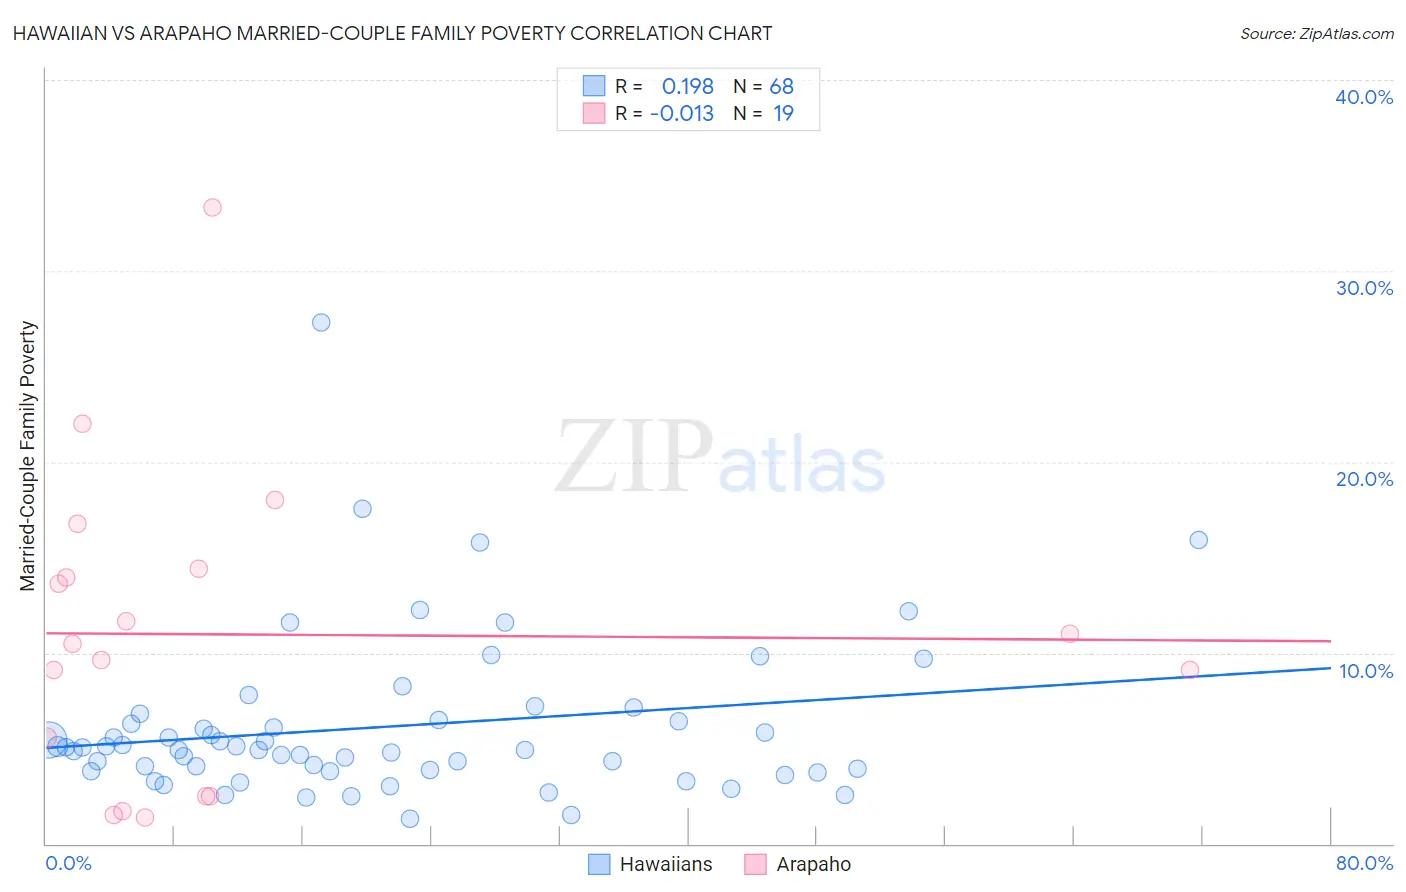
Hawaiian vs Arapaho Married-Couple Family Poverty Correlation Chart
The statistical analysis conducted on geographies consisting of 325,605,449 people shows a poor positive correlation between the proportion of Hawaiians and poverty level among married-couple families in the United States with a correlation coefficient (R) of 0.198 and weighted average of 5.1%. Similarly, the statistical analysis conducted on geographies consisting of 29,746,597 people shows no correlation between the proportion of Arapaho and poverty level among married-couple families in the United States with a correlation coefficient (R) of -0.013 and weighted average of 6.6%, a difference of 27.7%.
Married-Couple Family Poverty Correlation Summary
| Measurement | Hawaiian | Arapaho |
| Minimum | 1.3% | 1.4% |
| Maximum | 27.3% | 33.3% |
| Range | 26.0% | 31.9% |
| Mean | 6.1% | 11.0% |
| Median | 5.0% | 10.5% |
| Interquartile 25% (IQ1) | 3.8% | 2.5% |
| Interquartile 75% (IQ3) | 6.4% | 14.4% |
| Interquartile Range (IQR) | 2.6% | 11.9% |
| Standard Deviation (Sample) | 4.2% | 8.1% |
| Standard Deviation (Population) | 4.2% | 7.9% |
Similar Demographics by Married-Couple Family Poverty
Demographics Similar to Hawaiians by Married-Couple Family Poverty
In terms of married-couple family poverty, the demographic groups most similar to Hawaiians are Immigrants from Malaysia (5.1%, a difference of 0.010%), Paraguayan (5.1%, a difference of 0.10%), Costa Rican (5.1%, a difference of 0.10%), Sierra Leonean (5.1%, a difference of 0.24%), and Immigrants from Jordan (5.1%, a difference of 0.55%).
| Demographics | Rating | Rank | Married-Couple Family Poverty |
| Argentineans | 70.7 /100 | #157 | Good 5.1% |
| Immigrants | South Eastern Asia | 70.4 /100 | #158 | Good 5.1% |
| Immigrants | Saudi Arabia | 70.3 /100 | #159 | Good 5.1% |
| Pennsylvania Germans | 68.5 /100 | #160 | Good 5.1% |
| Ethiopians | 68.1 /100 | #161 | Good 5.1% |
| Immigrants | Jordan | 66.5 /100 | #162 | Good 5.1% |
| Sierra Leoneans | 64.1 /100 | #163 | Good 5.1% |
| Hawaiians | 62.3 /100 | #164 | Good 5.1% |
| Immigrants | Malaysia | 62.2 /100 | #165 | Good 5.1% |
| Paraguayans | 61.5 /100 | #166 | Good 5.1% |
| Costa Ricans | 61.5 /100 | #167 | Good 5.1% |
| Immigrants | Uganda | 54.9 /100 | #168 | Average 5.2% |
| Ottawa | 54.5 /100 | #169 | Average 5.2% |
| Immigrants | Argentina | 54.4 /100 | #170 | Average 5.2% |
| Bermudans | 52.9 /100 | #171 | Average 5.2% |
Demographics Similar to Arapaho by Married-Couple Family Poverty
In terms of married-couple family poverty, the demographic groups most similar to Arapaho are Immigrants from Lebanon (6.6%, a difference of 0.080%), Belizean (6.5%, a difference of 0.26%), Immigrants from Barbados (6.5%, a difference of 0.29%), Nepalese (6.5%, a difference of 0.52%), and Salvadoran (6.5%, a difference of 0.70%).
| Demographics | Rating | Rank | Married-Couple Family Poverty |
| Guyanese | 0.0 /100 | #286 | Tragic 6.5% |
| Ecuadorians | 0.0 /100 | #287 | Tragic 6.5% |
| Salvadorans | 0.0 /100 | #288 | Tragic 6.5% |
| Nepalese | 0.0 /100 | #289 | Tragic 6.5% |
| Immigrants | Barbados | 0.0 /100 | #290 | Tragic 6.5% |
| Belizeans | 0.0 /100 | #291 | Tragic 6.5% |
| Immigrants | Lebanon | 0.0 /100 | #292 | Tragic 6.6% |
| Arapaho | 0.0 /100 | #293 | Tragic 6.6% |
| Bahamians | 0.0 /100 | #294 | Tragic 6.6% |
| Immigrants | Uzbekistan | 0.0 /100 | #295 | Tragic 6.6% |
| U.S. Virgin Islanders | 0.0 /100 | #296 | Tragic 6.6% |
| Kiowa | 0.0 /100 | #297 | Tragic 6.6% |
| Immigrants | Guyana | 0.0 /100 | #298 | Tragic 6.7% |
| Nicaraguans | 0.0 /100 | #299 | Tragic 6.7% |
| Immigrants | Belize | 0.0 /100 | #300 | Tragic 6.7% |