Immigrants from Russia vs Arapaho Married-Couple Family Poverty
COMPARE
Immigrants from Russia
Arapaho
Married-Couple Family Poverty
Married-Couple Family Poverty Comparison
Immigrants from Russia
Arapaho
5.0%
MARRIED-COUPLE FAMILY POVERTY
78.7/ 100
METRIC RATING
148th/ 347
METRIC RANK
6.6%
MARRIED-COUPLE FAMILY POVERTY
0.0/ 100
METRIC RATING
293rd/ 347
METRIC RANK
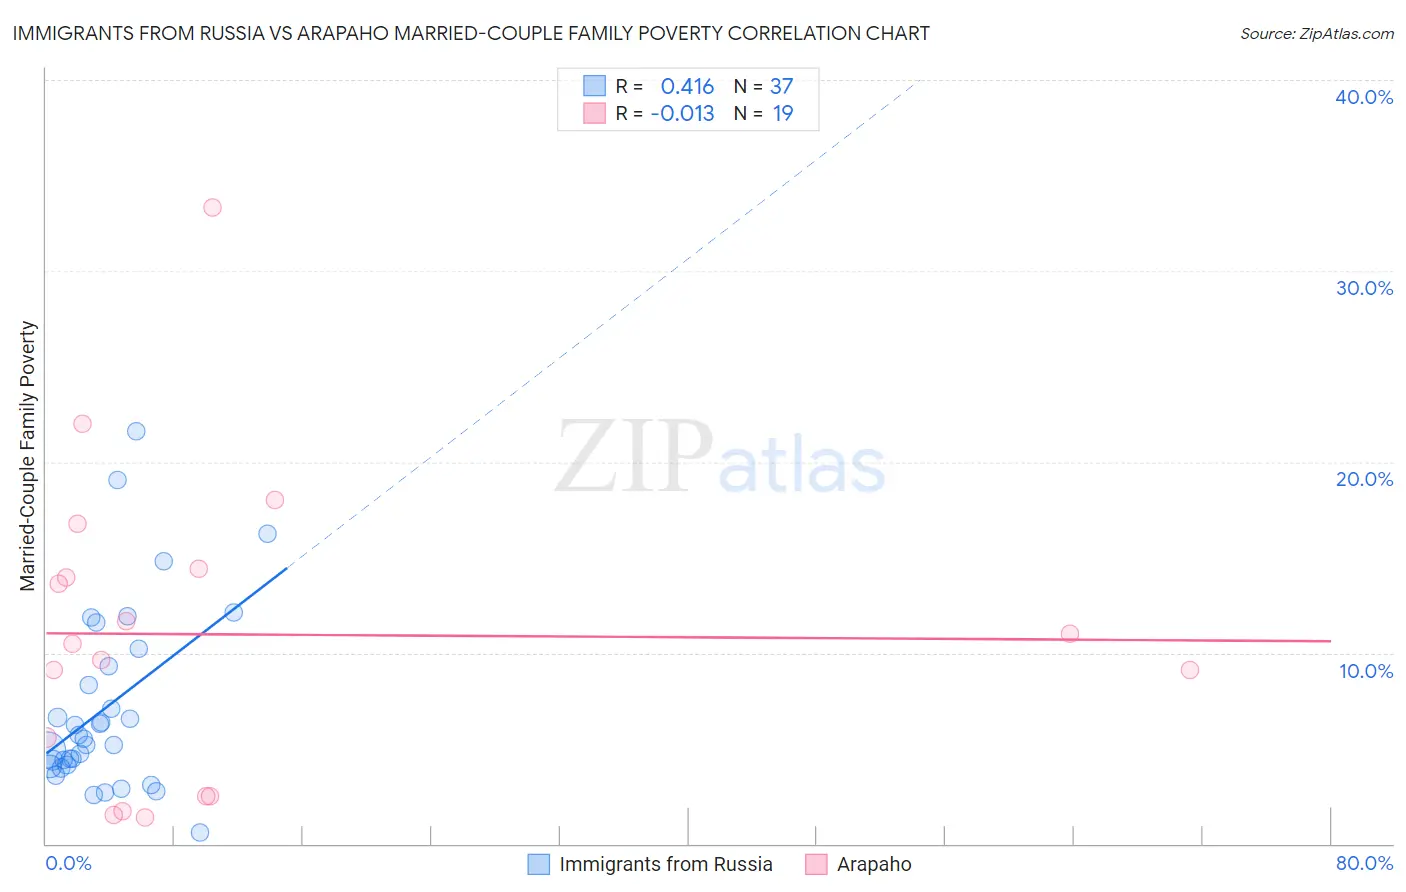
Immigrants from Russia vs Arapaho Married-Couple Family Poverty Correlation Chart
The statistical analysis conducted on geographies consisting of 344,976,831 people shows a moderate positive correlation between the proportion of Immigrants from Russia and poverty level among married-couple families in the United States with a correlation coefficient (R) of 0.416 and weighted average of 5.0%. Similarly, the statistical analysis conducted on geographies consisting of 29,746,597 people shows no correlation between the proportion of Arapaho and poverty level among married-couple families in the United States with a correlation coefficient (R) of -0.013 and weighted average of 6.6%, a difference of 30.8%.
Married-Couple Family Poverty Correlation Summary
| Measurement | Immigrants from Russia | Arapaho |
| Minimum | 0.60% | 1.4% |
| Maximum | 21.6% | 33.3% |
| Range | 21.0% | 31.9% |
| Mean | 7.2% | 11.0% |
| Median | 5.5% | 10.5% |
| Interquartile 25% (IQ1) | 4.1% | 2.5% |
| Interquartile 75% (IQ3) | 9.8% | 14.4% |
| Interquartile Range (IQR) | 5.7% | 11.9% |
| Standard Deviation (Sample) | 4.8% | 8.1% |
| Standard Deviation (Population) | 4.7% | 7.9% |
Similar Demographics by Married-Couple Family Poverty
Demographics Similar to Immigrants from Russia by Married-Couple Family Poverty
In terms of married-couple family poverty, the demographic groups most similar to Immigrants from Russia are Syrian (5.0%, a difference of 0.0%), Immigrants from Oceania (5.0%, a difference of 0.030%), Brazilian (5.0%, a difference of 0.080%), Mongolian (5.0%, a difference of 0.20%), and Immigrants from Spain (5.0%, a difference of 0.21%).
| Demographics | Rating | Rank | Married-Couple Family Poverty |
| Immigrants | Brazil | 84.6 /100 | #141 | Excellent 5.0% |
| Immigrants | China | 84.6 /100 | #142 | Excellent 5.0% |
| Immigrants | Egypt | 83.4 /100 | #143 | Excellent 5.0% |
| Hmong | 83.2 /100 | #144 | Excellent 5.0% |
| Immigrants | Spain | 79.9 /100 | #145 | Good 5.0% |
| Mongolians | 79.8 /100 | #146 | Good 5.0% |
| Syrians | 78.7 /100 | #147 | Good 5.0% |
| Immigrants | Russia | 78.7 /100 | #148 | Good 5.0% |
| Immigrants | Oceania | 78.6 /100 | #149 | Good 5.0% |
| Brazilians | 78.3 /100 | #150 | Good 5.0% |
| Immigrants | Cameroon | 77.3 /100 | #151 | Good 5.0% |
| Albanians | 77.2 /100 | #152 | Good 5.0% |
| Immigrants | Kuwait | 76.3 /100 | #153 | Good 5.0% |
| Delaware | 73.7 /100 | #154 | Good 5.1% |
| Immigrants | Ethiopia | 72.4 /100 | #155 | Good 5.1% |
Demographics Similar to Arapaho by Married-Couple Family Poverty
In terms of married-couple family poverty, the demographic groups most similar to Arapaho are Immigrants from Lebanon (6.6%, a difference of 0.080%), Belizean (6.5%, a difference of 0.26%), Immigrants from Barbados (6.5%, a difference of 0.29%), Nepalese (6.5%, a difference of 0.52%), and Salvadoran (6.5%, a difference of 0.70%).
| Demographics | Rating | Rank | Married-Couple Family Poverty |
| Guyanese | 0.0 /100 | #286 | Tragic 6.5% |
| Ecuadorians | 0.0 /100 | #287 | Tragic 6.5% |
| Salvadorans | 0.0 /100 | #288 | Tragic 6.5% |
| Nepalese | 0.0 /100 | #289 | Tragic 6.5% |
| Immigrants | Barbados | 0.0 /100 | #290 | Tragic 6.5% |
| Belizeans | 0.0 /100 | #291 | Tragic 6.5% |
| Immigrants | Lebanon | 0.0 /100 | #292 | Tragic 6.6% |
| Arapaho | 0.0 /100 | #293 | Tragic 6.6% |
| Bahamians | 0.0 /100 | #294 | Tragic 6.6% |
| Immigrants | Uzbekistan | 0.0 /100 | #295 | Tragic 6.6% |
| U.S. Virgin Islanders | 0.0 /100 | #296 | Tragic 6.6% |
| Kiowa | 0.0 /100 | #297 | Tragic 6.6% |
| Immigrants | Guyana | 0.0 /100 | #298 | Tragic 6.7% |
| Nicaraguans | 0.0 /100 | #299 | Tragic 6.7% |
| Immigrants | Belize | 0.0 /100 | #300 | Tragic 6.7% |