Hawaiian vs Arapaho 1 or more Vehicles in Household
COMPARE
Hawaiian
Arapaho
1 or more Vehicles in Household
1 or more Vehicles in Household Comparison
Hawaiians
Arapaho
92.0%
1 OR MORE VEHICLES IN HOUSEHOLD
99.9/ 100
METRIC RATING
53rd/ 347
METRIC RANK
92.7%
1 OR MORE VEHICLES IN HOUSEHOLD
100.0/ 100
METRIC RATING
20th/ 347
METRIC RANK
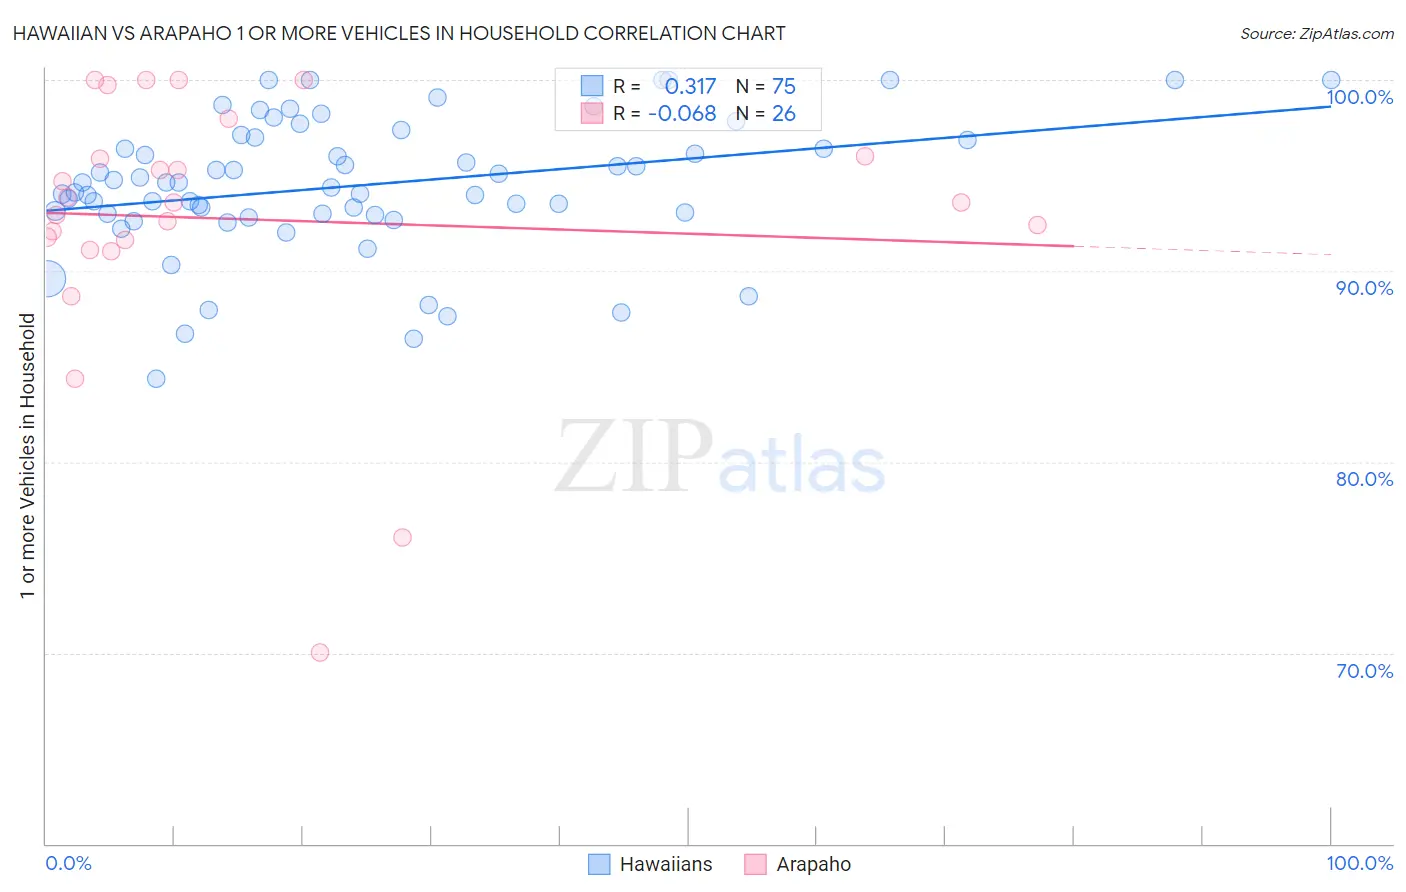
Hawaiian vs Arapaho 1 or more Vehicles in Household Correlation Chart
The statistical analysis conducted on geographies consisting of 327,409,815 people shows a mild positive correlation between the proportion of Hawaiians and percentage of households with 1 or more vehicles available in the United States with a correlation coefficient (R) of 0.317 and weighted average of 92.0%. Similarly, the statistical analysis conducted on geographies consisting of 29,777,132 people shows a slight negative correlation between the proportion of Arapaho and percentage of households with 1 or more vehicles available in the United States with a correlation coefficient (R) of -0.068 and weighted average of 92.7%, a difference of 0.73%.
1 or more Vehicles in Household Correlation Summary
| Measurement | Hawaiian | Arapaho |
| Minimum | 84.3% | 70.0% |
| Maximum | 100.0% | 100.0% |
| Range | 15.7% | 30.0% |
| Mean | 94.5% | 92.7% |
| Median | 94.6% | 93.6% |
| Interquartile 25% (IQ1) | 93.0% | 91.6% |
| Interquartile 75% (IQ3) | 97.0% | 96.0% |
| Interquartile Range (IQR) | 4.0% | 4.4% |
| Standard Deviation (Sample) | 3.5% | 7.0% |
| Standard Deviation (Population) | 3.5% | 6.8% |
Similar Demographics by 1 or more Vehicles in Household
Demographics Similar to Hawaiians by 1 or more Vehicles in Household
In terms of 1 or more vehicles in household, the demographic groups most similar to Hawaiians are Slovene (92.0%, a difference of 0.010%), Korean (92.1%, a difference of 0.030%), Celtic (92.1%, a difference of 0.060%), Guamanian/Chamorro (92.1%, a difference of 0.070%), and Immigrants from Afghanistan (92.0%, a difference of 0.070%).
| Demographics | Rating | Rank | 1 or more Vehicles in Household |
| Immigrants | Fiji | 99.9 /100 | #46 | Exceptional 92.2% |
| Northern Europeans | 99.9 /100 | #47 | Exceptional 92.2% |
| Belgians | 99.9 /100 | #48 | Exceptional 92.1% |
| Afghans | 99.9 /100 | #49 | Exceptional 92.1% |
| Guamanians/Chamorros | 99.9 /100 | #50 | Exceptional 92.1% |
| Celtics | 99.9 /100 | #51 | Exceptional 92.1% |
| Koreans | 99.9 /100 | #52 | Exceptional 92.1% |
| Hawaiians | 99.9 /100 | #53 | Exceptional 92.0% |
| Slovenes | 99.9 /100 | #54 | Exceptional 92.0% |
| Immigrants | Afghanistan | 99.9 /100 | #55 | Exceptional 92.0% |
| Immigrants | Venezuela | 99.9 /100 | #56 | Exceptional 92.0% |
| Iraqis | 99.8 /100 | #57 | Exceptional 91.9% |
| Immigrants | Mexico | 99.8 /100 | #58 | Exceptional 91.9% |
| Venezuelans | 99.8 /100 | #59 | Exceptional 91.9% |
| Slovaks | 99.8 /100 | #60 | Exceptional 91.9% |
Demographics Similar to Arapaho by 1 or more Vehicles in Household
In terms of 1 or more vehicles in household, the demographic groups most similar to Arapaho are Ottawa (92.7%, a difference of 0.020%), French (92.7%, a difference of 0.030%), Nepalese (92.6%, a difference of 0.10%), Yaqui (92.6%, a difference of 0.16%), and Tongan (92.9%, a difference of 0.17%).
| Demographics | Rating | Rank | 1 or more Vehicles in Household |
| Whites/Caucasians | 100.0 /100 | #13 | Exceptional 93.1% |
| Irish | 100.0 /100 | #14 | Exceptional 93.1% |
| Mexicans | 100.0 /100 | #15 | Exceptional 93.0% |
| Assyrians/Chaldeans/Syriacs | 100.0 /100 | #16 | Exceptional 93.0% |
| Europeans | 100.0 /100 | #17 | Exceptional 93.0% |
| Welsh | 100.0 /100 | #18 | Exceptional 93.0% |
| Tongans | 100.0 /100 | #19 | Exceptional 92.9% |
| Arapaho | 100.0 /100 | #20 | Exceptional 92.7% |
| Ottawa | 100.0 /100 | #21 | Exceptional 92.7% |
| French | 100.0 /100 | #22 | Exceptional 92.7% |
| Nepalese | 100.0 /100 | #23 | Exceptional 92.6% |
| Yaqui | 100.0 /100 | #24 | Exceptional 92.6% |
| Immigrants | Iraq | 100.0 /100 | #25 | Exceptional 92.5% |
| British | 100.0 /100 | #26 | Exceptional 92.5% |
| Americans | 100.0 /100 | #27 | Exceptional 92.5% |