Hawaiian vs Arapaho Median Household Income
COMPARE
Hawaiian
Arapaho
Median Household Income
Median Household Income Comparison
Hawaiians
Arapaho
$84,729
MEDIAN HOUSEHOLD INCOME
44.1/ 100
METRIC RATING
181st/ 347
METRIC RANK
$67,965
MEDIAN HOUSEHOLD INCOME
0.0/ 100
METRIC RATING
330th/ 347
METRIC RANK
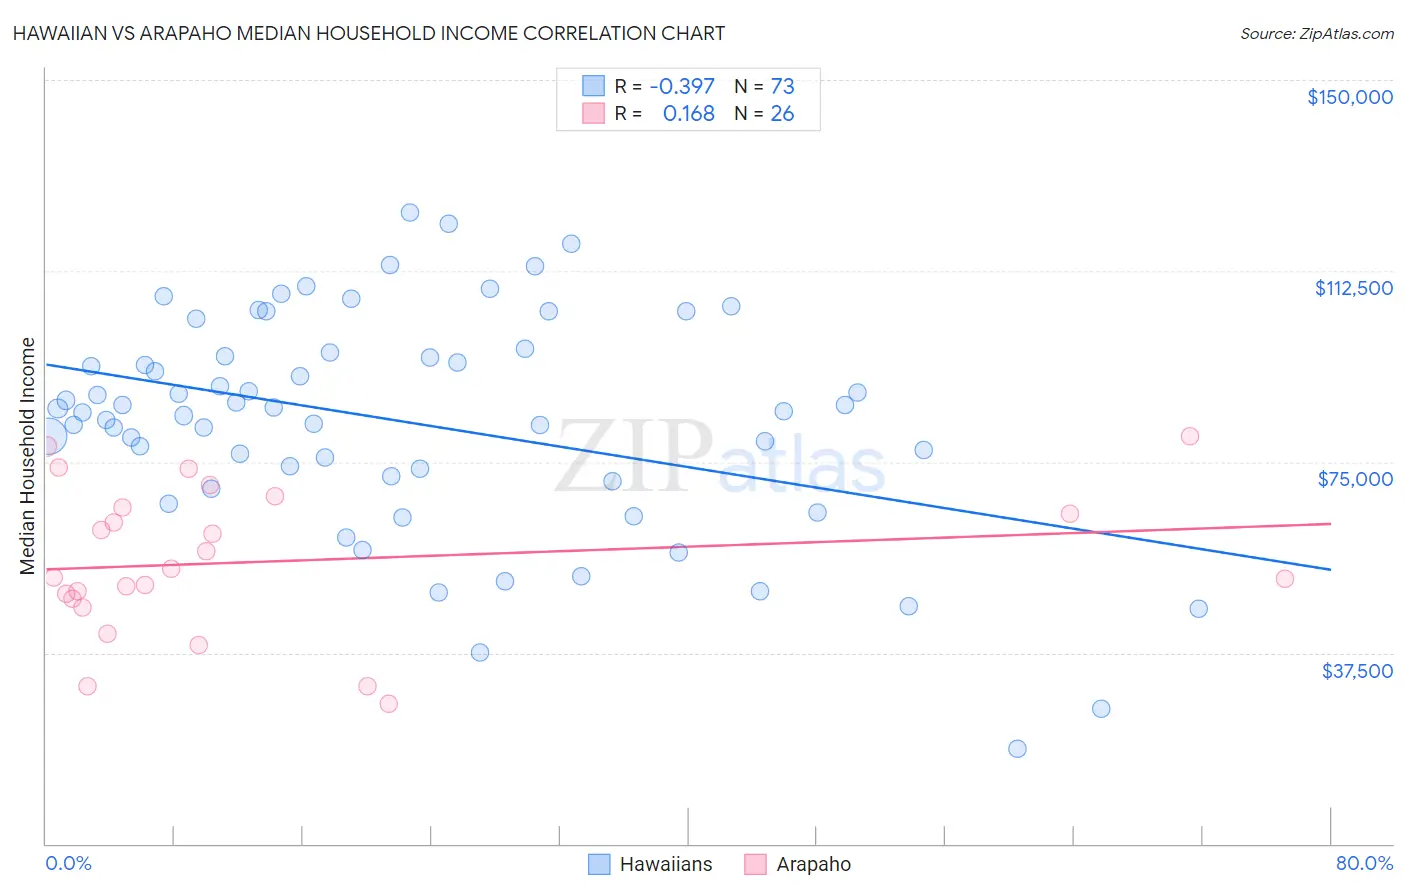
Hawaiian vs Arapaho Median Household Income Correlation Chart
The statistical analysis conducted on geographies consisting of 327,346,569 people shows a mild negative correlation between the proportion of Hawaiians and median household income in the United States with a correlation coefficient (R) of -0.397 and weighted average of $84,729. Similarly, the statistical analysis conducted on geographies consisting of 29,777,139 people shows a poor positive correlation between the proportion of Arapaho and median household income in the United States with a correlation coefficient (R) of 0.168 and weighted average of $67,965, a difference of 24.7%.
Median Household Income Correlation Summary
| Measurement | Hawaiian | Arapaho |
| Minimum | $18,739 | $27,500 |
| Maximum | $123,859 | $80,000 |
| Range | $105,120 | $52,500 |
| Mean | $82,769 | $55,430 |
| Median | $85,043 | $53,182 |
| Interquartile 25% (IQ1) | $71,702 | $47,998 |
| Interquartile 75% (IQ3) | $96,092 | $66,111 |
| Interquartile Range (IQR) | $24,390 | $18,113 |
| Standard Deviation (Sample) | $21,670 | $14,479 |
| Standard Deviation (Population) | $21,522 | $14,198 |
Similar Demographics by Median Household Income
Demographics Similar to Hawaiians by Median Household Income
In terms of median household income, the demographic groups most similar to Hawaiians are Immigrants from Portugal ($84,740, a difference of 0.010%), Uruguayan ($84,691, a difference of 0.040%), Spaniard ($84,644, a difference of 0.10%), English ($84,915, a difference of 0.22%), and Czechoslovakian ($84,965, a difference of 0.28%).
| Demographics | Rating | Rank | Median Household Income |
| Scottish | 50.0 /100 | #174 | Average $85,101 |
| Immigrants | Costa Rica | 49.2 /100 | #175 | Average $85,054 |
| Alsatians | 49.2 /100 | #176 | Average $85,053 |
| Immigrants | Eritrea | 48.8 /100 | #177 | Average $85,025 |
| Czechoslovakians | 47.8 /100 | #178 | Average $84,965 |
| English | 47.0 /100 | #179 | Average $84,915 |
| Immigrants | Portugal | 44.2 /100 | #180 | Average $84,740 |
| Hawaiians | 44.1 /100 | #181 | Average $84,729 |
| Uruguayans | 43.5 /100 | #182 | Average $84,691 |
| Spaniards | 42.7 /100 | #183 | Average $84,644 |
| Immigrants | Eastern Africa | 37.4 /100 | #184 | Fair $84,299 |
| Kenyans | 34.2 /100 | #185 | Fair $84,085 |
| Puget Sound Salish | 33.2 /100 | #186 | Fair $84,011 |
| Belgians | 33.2 /100 | #187 | Fair $84,008 |
| Tlingit-Haida | 32.6 /100 | #188 | Fair $83,968 |
Demographics Similar to Arapaho by Median Household Income
In terms of median household income, the demographic groups most similar to Arapaho are Native/Alaskan ($67,879, a difference of 0.13%), Sioux ($67,792, a difference of 0.25%), Creek ($67,715, a difference of 0.37%), Black/African American ($67,573, a difference of 0.58%), and Dutch West Indian ($68,412, a difference of 0.66%).
| Demographics | Rating | Rank | Median Household Income |
| Bahamians | 0.0 /100 | #323 | Tragic $69,726 |
| Yup'ik | 0.0 /100 | #324 | Tragic $69,695 |
| Seminole | 0.0 /100 | #325 | Tragic $69,420 |
| Yuman | 0.0 /100 | #326 | Tragic $68,743 |
| Immigrants | Cuba | 0.0 /100 | #327 | Tragic $68,461 |
| Menominee | 0.0 /100 | #328 | Tragic $68,423 |
| Dutch West Indians | 0.0 /100 | #329 | Tragic $68,412 |
| Arapaho | 0.0 /100 | #330 | Tragic $67,965 |
| Natives/Alaskans | 0.0 /100 | #331 | Tragic $67,879 |
| Sioux | 0.0 /100 | #332 | Tragic $67,792 |
| Creek | 0.0 /100 | #333 | Tragic $67,715 |
| Blacks/African Americans | 0.0 /100 | #334 | Tragic $67,573 |
| Cheyenne | 0.0 /100 | #335 | Tragic $66,974 |
| Immigrants | Congo | 0.0 /100 | #336 | Tragic $66,768 |
| Kiowa | 0.0 /100 | #337 | Tragic $65,914 |