Guyanese vs Cape Verdean Female Unemployment
COMPARE
Guyanese
Cape Verdean
Female Unemployment
Female Unemployment Comparison
Guyanese
Cape Verdeans
6.7%
FEMALE UNEMPLOYMENT
0.0/ 100
METRIC RATING
328th/ 347
METRIC RANK
5.9%
FEMALE UNEMPLOYMENT
0.0/ 100
METRIC RATING
266th/ 347
METRIC RANK
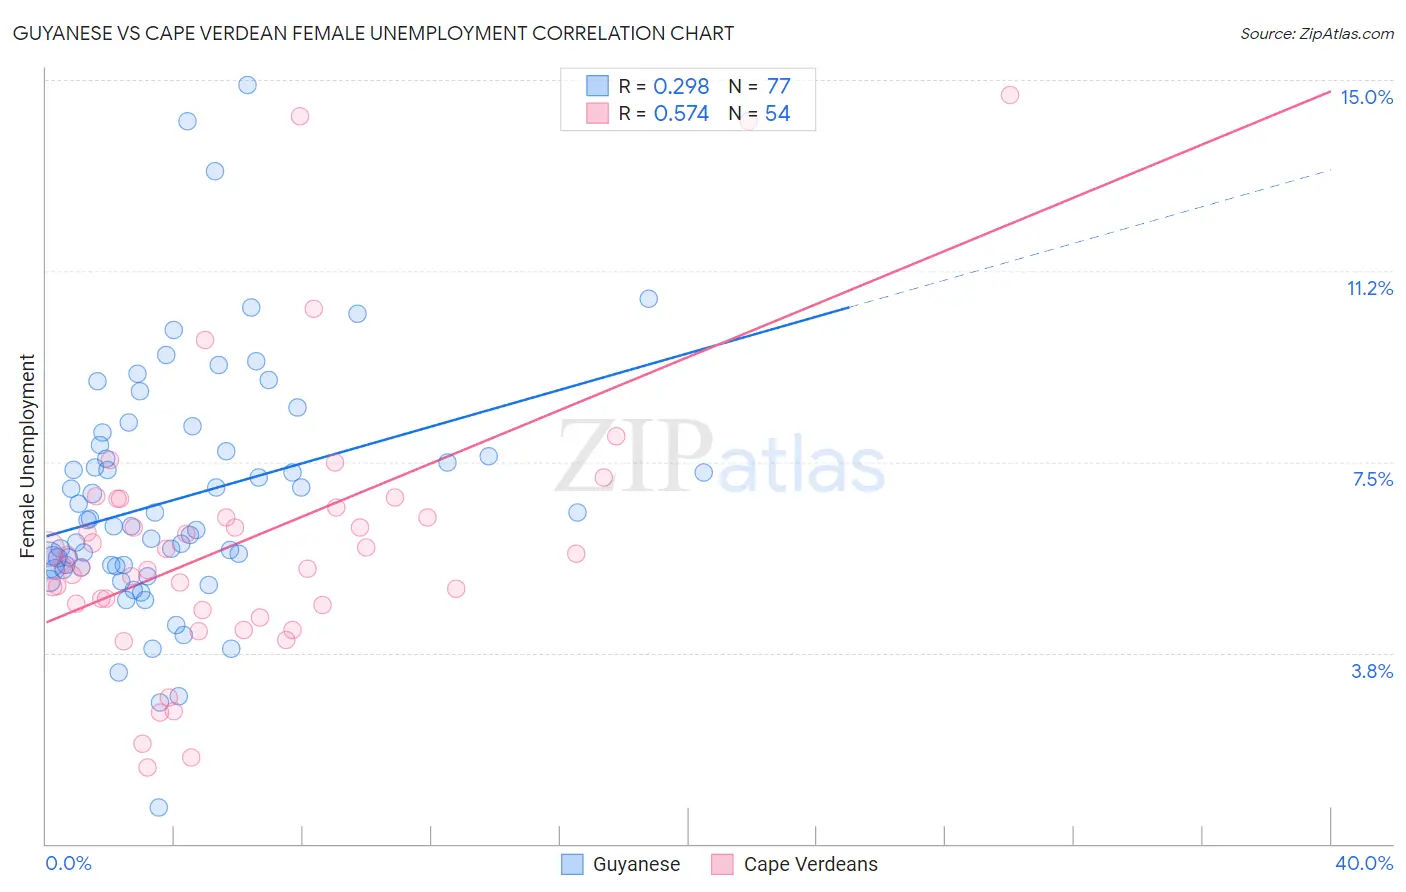
Guyanese vs Cape Verdean Female Unemployment Correlation Chart
The statistical analysis conducted on geographies consisting of 176,676,067 people shows a weak positive correlation between the proportion of Guyanese and unemploymnet rate among females in the United States with a correlation coefficient (R) of 0.298 and weighted average of 6.7%. Similarly, the statistical analysis conducted on geographies consisting of 107,445,837 people shows a substantial positive correlation between the proportion of Cape Verdeans and unemploymnet rate among females in the United States with a correlation coefficient (R) of 0.574 and weighted average of 5.9%, a difference of 13.3%.
Female Unemployment Correlation Summary
| Measurement | Guyanese | Cape Verdean |
| Minimum | 0.70% | 1.5% |
| Maximum | 14.9% | 14.7% |
| Range | 14.2% | 13.2% |
| Mean | 6.8% | 5.9% |
| Median | 6.2% | 5.6% |
| Interquartile 25% (IQ1) | 5.4% | 4.7% |
| Interquartile 75% (IQ3) | 7.8% | 6.6% |
| Interquartile Range (IQR) | 2.3% | 1.9% |
| Standard Deviation (Sample) | 2.4% | 2.7% |
| Standard Deviation (Population) | 2.4% | 2.7% |
Similar Demographics by Female Unemployment
Demographics Similar to Guyanese by Female Unemployment
In terms of female unemployment, the demographic groups most similar to Guyanese are Immigrants from Guyana (6.7%, a difference of 0.37%), Alaska Native (6.6%, a difference of 0.44%), Native/Alaskan (6.6%, a difference of 0.52%), Yakama (6.7%, a difference of 0.94%), and Apache (6.6%, a difference of 1.1%).
| Demographics | Rating | Rank | Female Unemployment |
| Blacks/African Americans | 0.0 /100 | #321 | Tragic 6.5% |
| Vietnamese | 0.0 /100 | #322 | Tragic 6.5% |
| Immigrants | Belize | 0.0 /100 | #323 | Tragic 6.5% |
| Cheyenne | 0.0 /100 | #324 | Tragic 6.6% |
| Apache | 0.0 /100 | #325 | Tragic 6.6% |
| Natives/Alaskans | 0.0 /100 | #326 | Tragic 6.6% |
| Alaska Natives | 0.0 /100 | #327 | Tragic 6.6% |
| Guyanese | 0.0 /100 | #328 | Tragic 6.7% |
| Immigrants | Guyana | 0.0 /100 | #329 | Tragic 6.7% |
| Yakama | 0.0 /100 | #330 | Tragic 6.7% |
| Paiute | 0.0 /100 | #331 | Tragic 6.8% |
| Sioux | 0.0 /100 | #332 | Tragic 7.0% |
| Menominee | 0.0 /100 | #333 | Tragic 7.0% |
| Immigrants | Armenia | 0.0 /100 | #334 | Tragic 7.1% |
| Dominicans | 0.0 /100 | #335 | Tragic 7.2% |
Demographics Similar to Cape Verdeans by Female Unemployment
In terms of female unemployment, the demographic groups most similar to Cape Verdeans are Nepalese (5.9%, a difference of 0.11%), Honduran (5.9%, a difference of 0.20%), Blackfeet (5.9%, a difference of 0.28%), Immigrants from Western Africa (5.9%, a difference of 0.40%), and Immigrants from Bahamas (5.8%, a difference of 0.68%).
| Demographics | Rating | Rank | Female Unemployment |
| Immigrants | Fiji | 0.2 /100 | #259 | Tragic 5.8% |
| Nigerians | 0.2 /100 | #260 | Tragic 5.8% |
| Kiowa | 0.1 /100 | #261 | Tragic 5.8% |
| Immigrants | Nigeria | 0.1 /100 | #262 | Tragic 5.8% |
| Immigrants | Azores | 0.1 /100 | #263 | Tragic 5.8% |
| Immigrants | Bahamas | 0.1 /100 | #264 | Tragic 5.8% |
| Blackfeet | 0.0 /100 | #265 | Tragic 5.9% |
| Cape Verdeans | 0.0 /100 | #266 | Tragic 5.9% |
| Nepalese | 0.0 /100 | #267 | Tragic 5.9% |
| Hondurans | 0.0 /100 | #268 | Tragic 5.9% |
| Immigrants | Western Africa | 0.0 /100 | #269 | Tragic 5.9% |
| Immigrants | Honduras | 0.0 /100 | #270 | Tragic 5.9% |
| Central Americans | 0.0 /100 | #271 | Tragic 5.9% |
| Lumbee | 0.0 /100 | #272 | Tragic 5.9% |
| Ghanaians | 0.0 /100 | #273 | Tragic 5.9% |