Cuban vs Cape Verdean Single Female Poverty
COMPARE
Cuban
Cape Verdean
Single Female Poverty
Single Female Poverty Comparison
Cubans
Cape Verdeans
21.0%
SINGLE FEMALE POVERTY
50.0/ 100
METRIC RATING
174th/ 347
METRIC RANK
22.3%
SINGLE FEMALE POVERTY
2.1/ 100
METRIC RATING
241st/ 347
METRIC RANK
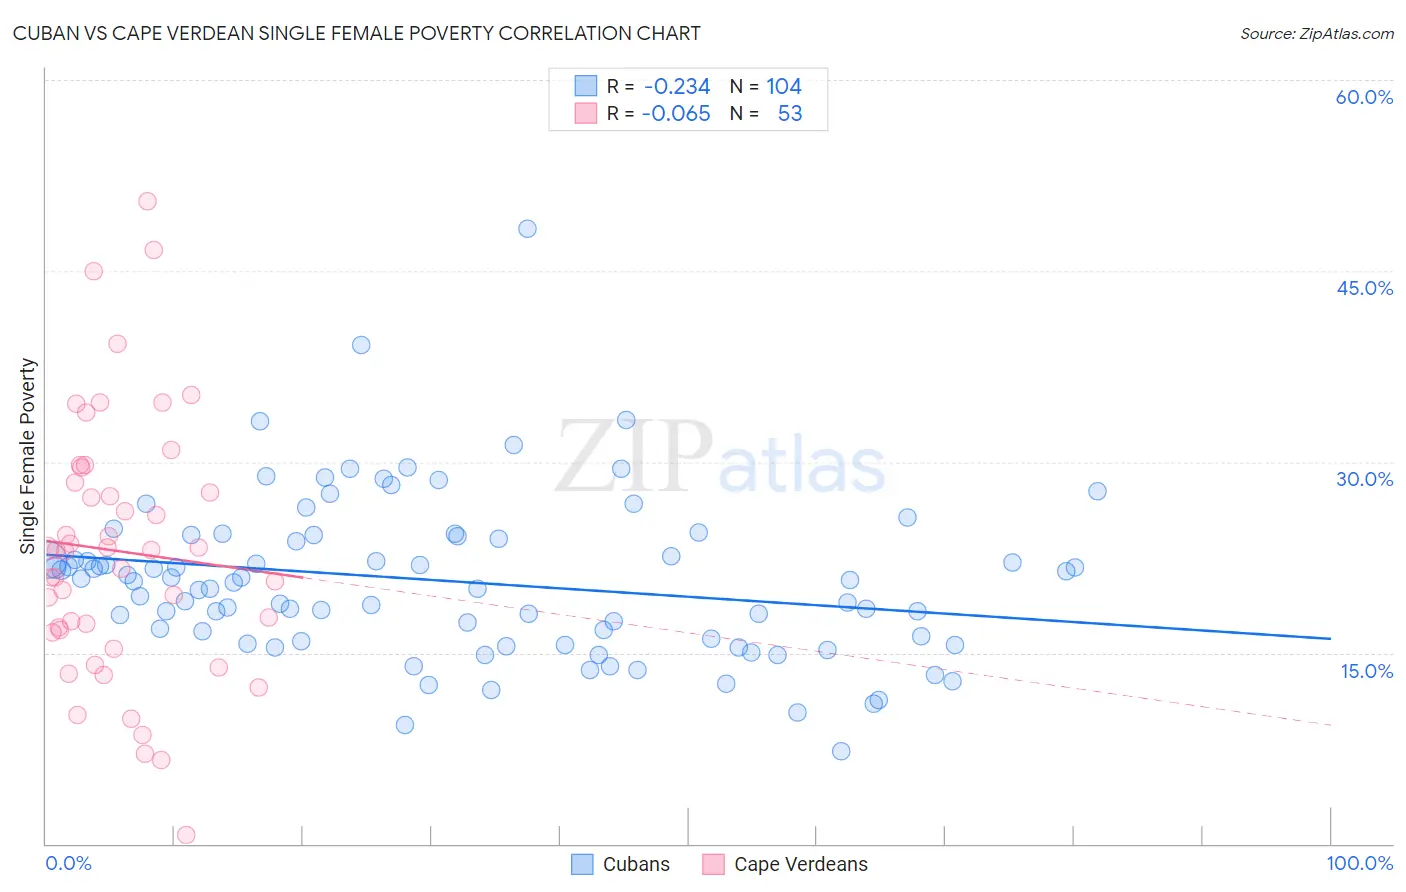
Cuban vs Cape Verdean Single Female Poverty Correlation Chart
The statistical analysis conducted on geographies consisting of 441,584,431 people shows a weak negative correlation between the proportion of Cubans and poverty level among single females in the United States with a correlation coefficient (R) of -0.234 and weighted average of 21.0%. Similarly, the statistical analysis conducted on geographies consisting of 107,029,522 people shows a slight negative correlation between the proportion of Cape Verdeans and poverty level among single females in the United States with a correlation coefficient (R) of -0.065 and weighted average of 22.3%, a difference of 6.0%.
Single Female Poverty Correlation Summary
| Measurement | Cuban | Cape Verdean |
| Minimum | 7.2% | 0.66% |
| Maximum | 48.3% | 50.5% |
| Range | 41.1% | 49.8% |
| Mean | 20.6% | 23.0% |
| Median | 20.6% | 23.1% |
| Interquartile 25% (IQ1) | 16.0% | 16.7% |
| Interquartile 75% (IQ3) | 24.0% | 28.9% |
| Interquartile Range (IQR) | 8.0% | 12.2% |
| Standard Deviation (Sample) | 6.3% | 10.2% |
| Standard Deviation (Population) | 6.3% | 10.1% |
Similar Demographics by Single Female Poverty
Demographics Similar to Cubans by Single Female Poverty
In terms of single female poverty, the demographic groups most similar to Cubans are Immigrants from Guyana (21.0%, a difference of 0.040%), Guyanese (21.0%, a difference of 0.13%), Moroccan (21.0%, a difference of 0.17%), New Zealander (21.0%, a difference of 0.20%), and Czech (21.0%, a difference of 0.20%).
| Demographics | Rating | Rank | Single Female Poverty |
| Immigrants | Norway | 63.0 /100 | #167 | Good 20.8% |
| Immigrants | Costa Rica | 61.5 /100 | #168 | Good 20.9% |
| Immigrants | Trinidad and Tobago | 56.3 /100 | #169 | Average 20.9% |
| New Zealanders | 53.2 /100 | #170 | Average 21.0% |
| Moroccans | 52.8 /100 | #171 | Average 21.0% |
| Guyanese | 52.0 /100 | #172 | Average 21.0% |
| Immigrants | Guyana | 50.6 /100 | #173 | Average 21.0% |
| Cubans | 50.0 /100 | #174 | Average 21.0% |
| Czechs | 46.8 /100 | #175 | Average 21.0% |
| Canadians | 45.4 /100 | #176 | Average 21.1% |
| Scandinavians | 45.2 /100 | #177 | Average 21.1% |
| Immigrants | Bosnia and Herzegovina | 44.9 /100 | #178 | Average 21.1% |
| British | 42.9 /100 | #179 | Average 21.1% |
| Spanish American Indians | 42.5 /100 | #180 | Average 21.1% |
| Europeans | 42.3 /100 | #181 | Average 21.1% |
Demographics Similar to Cape Verdeans by Single Female Poverty
In terms of single female poverty, the demographic groups most similar to Cape Verdeans are Bermudan (22.3%, a difference of 0.070%), French (22.2%, a difference of 0.14%), West Indian (22.3%, a difference of 0.16%), Immigrants from Middle Africa (22.3%, a difference of 0.17%), and Immigrants from Bangladesh (22.3%, a difference of 0.21%).
| Demographics | Rating | Rank | Single Female Poverty |
| Spanish | 4.7 /100 | #234 | Tragic 22.0% |
| Dutch | 4.6 /100 | #235 | Tragic 22.0% |
| Immigrants | Ecuador | 4.2 /100 | #236 | Tragic 22.0% |
| Vietnamese | 4.0 /100 | #237 | Tragic 22.0% |
| French Canadians | 2.8 /100 | #238 | Tragic 22.2% |
| Malaysians | 2.8 /100 | #239 | Tragic 22.2% |
| French | 2.3 /100 | #240 | Tragic 22.2% |
| Cape Verdeans | 2.1 /100 | #241 | Tragic 22.3% |
| Bermudans | 2.0 /100 | #242 | Tragic 22.3% |
| West Indians | 1.9 /100 | #243 | Tragic 22.3% |
| Immigrants | Middle Africa | 1.9 /100 | #244 | Tragic 22.3% |
| Immigrants | Bangladesh | 1.8 /100 | #245 | Tragic 22.3% |
| Liberians | 1.4 /100 | #246 | Tragic 22.4% |
| Immigrants | El Salvador | 1.4 /100 | #247 | Tragic 22.4% |
| Belizeans | 1.4 /100 | #248 | Tragic 22.4% |