Tlingit-Haida vs Cape Verdean Single Female Poverty
COMPARE
Tlingit-Haida
Cape Verdean
Single Female Poverty
Single Female Poverty Comparison
Tlingit-Haida
Cape Verdeans
21.9%
SINGLE FEMALE POVERTY
5.4/ 100
METRIC RATING
229th/ 347
METRIC RANK
22.3%
SINGLE FEMALE POVERTY
2.1/ 100
METRIC RATING
241st/ 347
METRIC RANK
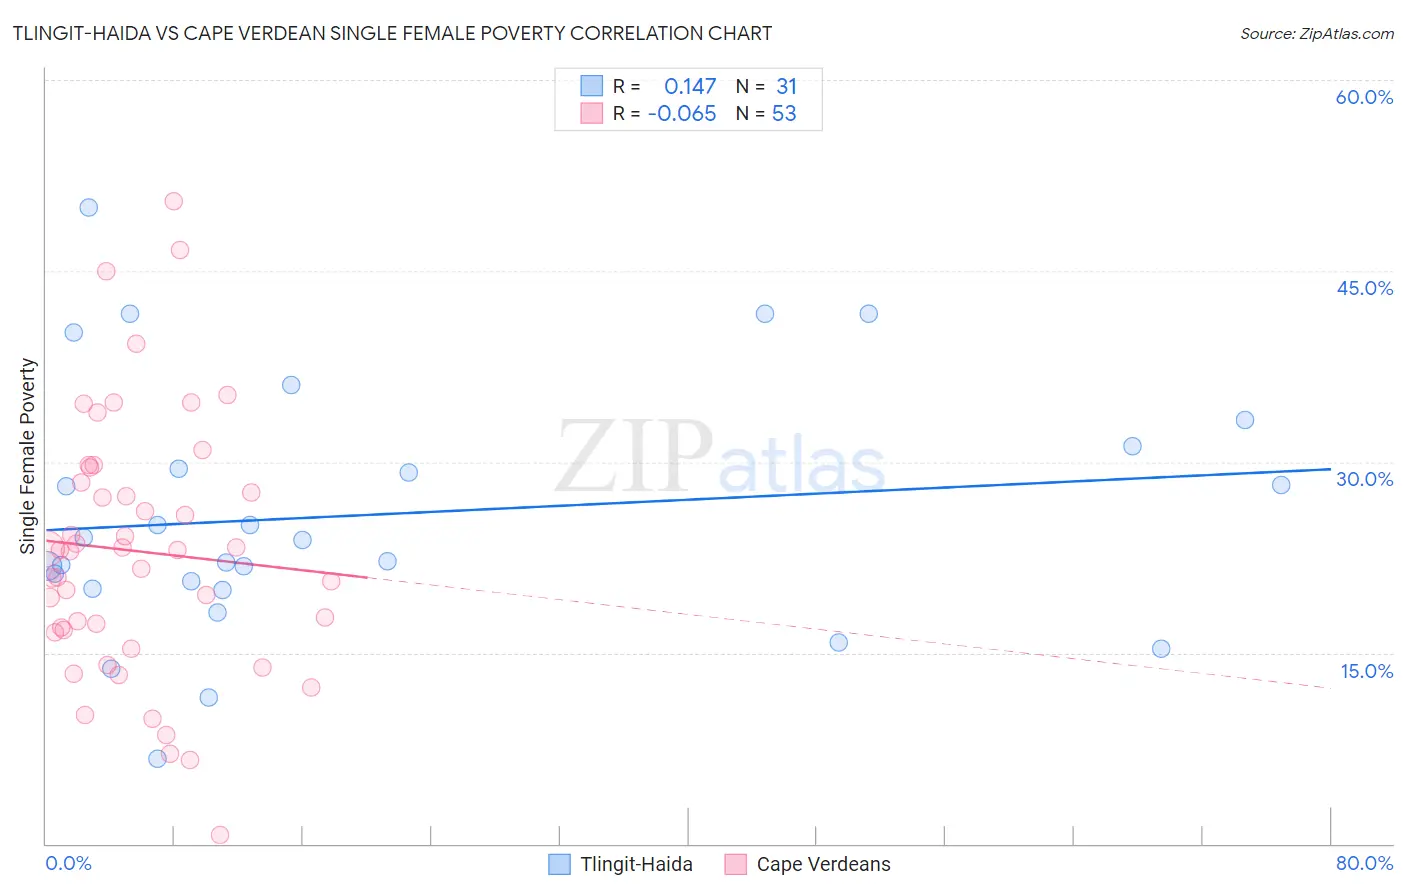
Tlingit-Haida vs Cape Verdean Single Female Poverty Correlation Chart
The statistical analysis conducted on geographies consisting of 60,536,912 people shows a poor positive correlation between the proportion of Tlingit-Haida and poverty level among single females in the United States with a correlation coefficient (R) of 0.147 and weighted average of 21.9%. Similarly, the statistical analysis conducted on geographies consisting of 107,029,522 people shows a slight negative correlation between the proportion of Cape Verdeans and poverty level among single females in the United States with a correlation coefficient (R) of -0.065 and weighted average of 22.3%, a difference of 1.4%.
Single Female Poverty Correlation Summary
| Measurement | Tlingit-Haida | Cape Verdean |
| Minimum | 6.7% | 0.66% |
| Maximum | 50.0% | 50.5% |
| Range | 43.3% | 49.8% |
| Mean | 25.9% | 23.0% |
| Median | 23.9% | 23.1% |
| Interquartile 25% (IQ1) | 20.0% | 16.7% |
| Interquartile 75% (IQ3) | 31.2% | 28.9% |
| Interquartile Range (IQR) | 11.2% | 12.2% |
| Standard Deviation (Sample) | 9.9% | 10.2% |
| Standard Deviation (Population) | 9.8% | 10.1% |
Demographics Similar to Tlingit-Haida and Cape Verdeans by Single Female Poverty
In terms of single female poverty, the demographic groups most similar to Tlingit-Haida are Immigrants from Western Africa (22.0%, a difference of 0.020%), Salvadoran (21.9%, a difference of 0.030%), Welsh (22.0%, a difference of 0.11%), Immigrants from Ghana (21.9%, a difference of 0.12%), and Immigrants from Thailand (22.0%, a difference of 0.12%). Similarly, the demographic groups most similar to Cape Verdeans are Bermudan (22.3%, a difference of 0.070%), French (22.2%, a difference of 0.14%), West Indian (22.3%, a difference of 0.16%), Immigrants from Middle Africa (22.3%, a difference of 0.17%), and Immigrants from Bangladesh (22.3%, a difference of 0.21%).
| Demographics | Rating | Rank | Single Female Poverty |
| English | 6.4 /100 | #225 | Tragic 21.9% |
| Immigrants | Portugal | 5.8 /100 | #226 | Tragic 21.9% |
| Immigrants | Ghana | 5.8 /100 | #227 | Tragic 21.9% |
| Salvadorans | 5.5 /100 | #228 | Tragic 21.9% |
| Tlingit-Haida | 5.4 /100 | #229 | Tragic 21.9% |
| Immigrants | Western Africa | 5.3 /100 | #230 | Tragic 22.0% |
| Welsh | 5.0 /100 | #231 | Tragic 22.0% |
| Immigrants | Thailand | 5.0 /100 | #232 | Tragic 22.0% |
| Spaniards | 4.7 /100 | #233 | Tragic 22.0% |
| Spanish | 4.7 /100 | #234 | Tragic 22.0% |
| Dutch | 4.6 /100 | #235 | Tragic 22.0% |
| Immigrants | Ecuador | 4.2 /100 | #236 | Tragic 22.0% |
| Vietnamese | 4.0 /100 | #237 | Tragic 22.0% |
| French Canadians | 2.8 /100 | #238 | Tragic 22.2% |
| Malaysians | 2.8 /100 | #239 | Tragic 22.2% |
| French | 2.3 /100 | #240 | Tragic 22.2% |
| Cape Verdeans | 2.1 /100 | #241 | Tragic 22.3% |
| Bermudans | 2.0 /100 | #242 | Tragic 22.3% |
| West Indians | 1.9 /100 | #243 | Tragic 22.3% |
| Immigrants | Middle Africa | 1.9 /100 | #244 | Tragic 22.3% |
| Immigrants | Bangladesh | 1.8 /100 | #245 | Tragic 22.3% |