Liberian vs Cape Verdean Single Female Poverty
COMPARE
Liberian
Cape Verdean
Single Female Poverty
Single Female Poverty Comparison
Liberians
Cape Verdeans
22.4%
SINGLE FEMALE POVERTY
1.4/ 100
METRIC RATING
246th/ 347
METRIC RANK
22.3%
SINGLE FEMALE POVERTY
2.1/ 100
METRIC RATING
241st/ 347
METRIC RANK
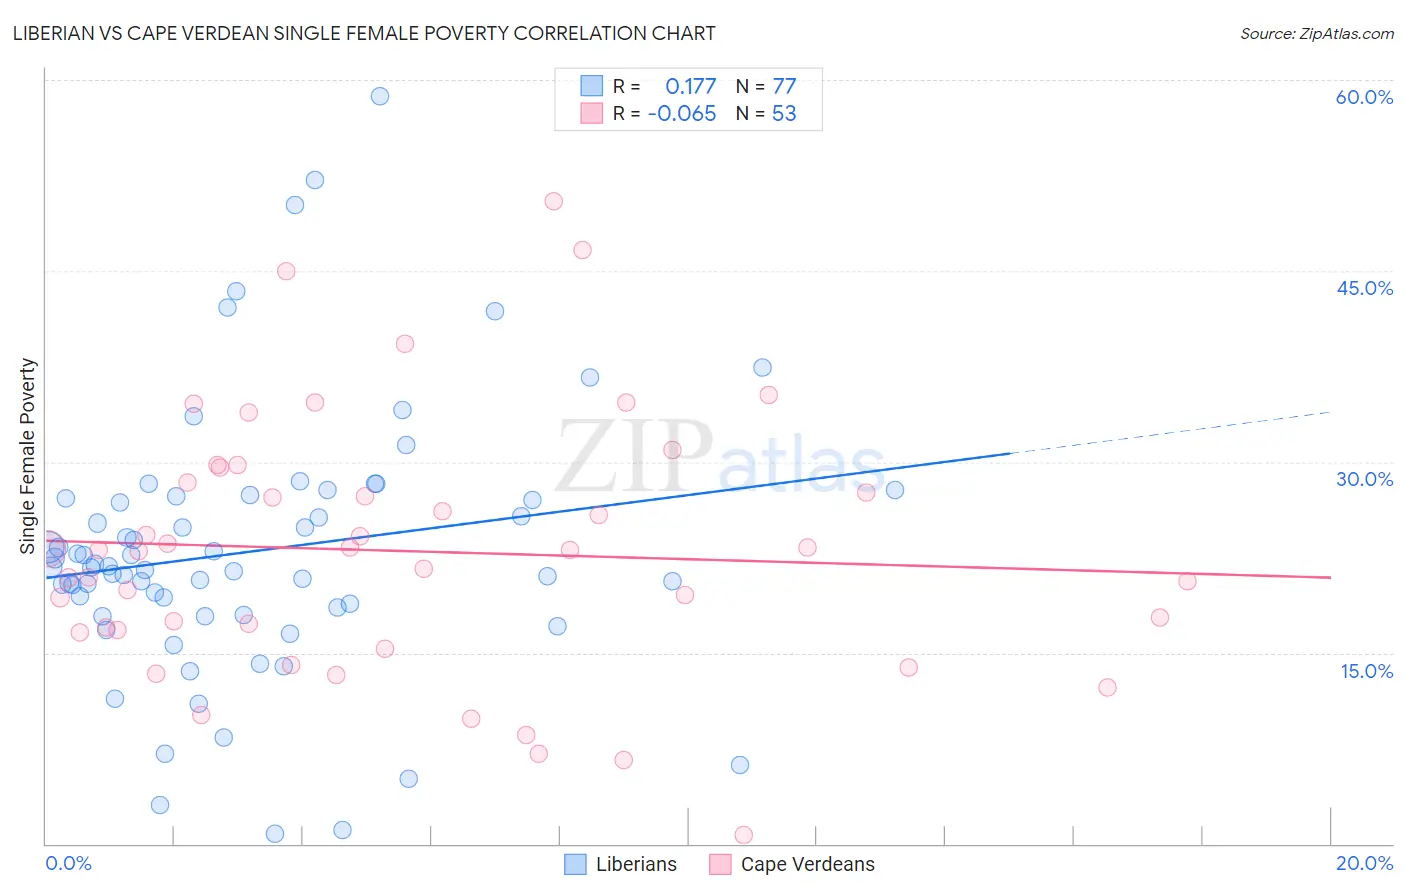
Liberian vs Cape Verdean Single Female Poverty Correlation Chart
The statistical analysis conducted on geographies consisting of 117,657,601 people shows a poor positive correlation between the proportion of Liberians and poverty level among single females in the United States with a correlation coefficient (R) of 0.177 and weighted average of 22.4%. Similarly, the statistical analysis conducted on geographies consisting of 107,029,522 people shows a slight negative correlation between the proportion of Cape Verdeans and poverty level among single females in the United States with a correlation coefficient (R) of -0.065 and weighted average of 22.3%, a difference of 0.58%.
Single Female Poverty Correlation Summary
| Measurement | Liberian | Cape Verdean |
| Minimum | 0.74% | 0.66% |
| Maximum | 58.7% | 50.5% |
| Range | 58.0% | 49.8% |
| Mean | 23.0% | 23.0% |
| Median | 21.7% | 23.1% |
| Interquartile 25% (IQ1) | 18.3% | 16.7% |
| Interquartile 75% (IQ3) | 27.2% | 28.9% |
| Interquartile Range (IQR) | 9.0% | 12.2% |
| Standard Deviation (Sample) | 10.5% | 10.2% |
| Standard Deviation (Population) | 10.4% | 10.1% |
Demographics Similar to Liberians and Cape Verdeans by Single Female Poverty
In terms of single female poverty, the demographic groups most similar to Liberians are Immigrants from El Salvador (22.4%, a difference of 0.060%), Belizean (22.4%, a difference of 0.070%), Immigrants from Caribbean (22.4%, a difference of 0.17%), Immigrants from Bahamas (22.5%, a difference of 0.32%), and Immigrants from Bangladesh (22.3%, a difference of 0.37%). Similarly, the demographic groups most similar to Cape Verdeans are Bermudan (22.3%, a difference of 0.070%), French (22.2%, a difference of 0.14%), West Indian (22.3%, a difference of 0.16%), Immigrants from Middle Africa (22.3%, a difference of 0.17%), and Immigrants from Bangladesh (22.3%, a difference of 0.21%).
| Demographics | Rating | Rank | Single Female Poverty |
| Spaniards | 4.7 /100 | #233 | Tragic 22.0% |
| Spanish | 4.7 /100 | #234 | Tragic 22.0% |
| Dutch | 4.6 /100 | #235 | Tragic 22.0% |
| Immigrants | Ecuador | 4.2 /100 | #236 | Tragic 22.0% |
| Vietnamese | 4.0 /100 | #237 | Tragic 22.0% |
| French Canadians | 2.8 /100 | #238 | Tragic 22.2% |
| Malaysians | 2.8 /100 | #239 | Tragic 22.2% |
| French | 2.3 /100 | #240 | Tragic 22.2% |
| Cape Verdeans | 2.1 /100 | #241 | Tragic 22.3% |
| Bermudans | 2.0 /100 | #242 | Tragic 22.3% |
| West Indians | 1.9 /100 | #243 | Tragic 22.3% |
| Immigrants | Middle Africa | 1.9 /100 | #244 | Tragic 22.3% |
| Immigrants | Bangladesh | 1.8 /100 | #245 | Tragic 22.3% |
| Liberians | 1.4 /100 | #246 | Tragic 22.4% |
| Immigrants | El Salvador | 1.4 /100 | #247 | Tragic 22.4% |
| Belizeans | 1.4 /100 | #248 | Tragic 22.4% |
| Immigrants | Caribbean | 1.3 /100 | #249 | Tragic 22.4% |
| Immigrants | Bahamas | 1.2 /100 | #250 | Tragic 22.5% |
| Immigrants | West Indies | 1.0 /100 | #251 | Tragic 22.5% |
| Delaware | 1.0 /100 | #252 | Tragic 22.5% |
| Immigrants | Liberia | 0.9 /100 | #253 | Tragic 22.5% |