German Russian vs Syrian Male Poverty
COMPARE
German Russian
Syrian
Male Poverty
Male Poverty Comparison
German Russians
Syrians
12.2%
MALE POVERTY
2.5/ 100
METRIC RATING
218th/ 347
METRIC RANK
10.9%
MALE POVERTY
71.4/ 100
METRIC RATING
146th/ 347
METRIC RANK
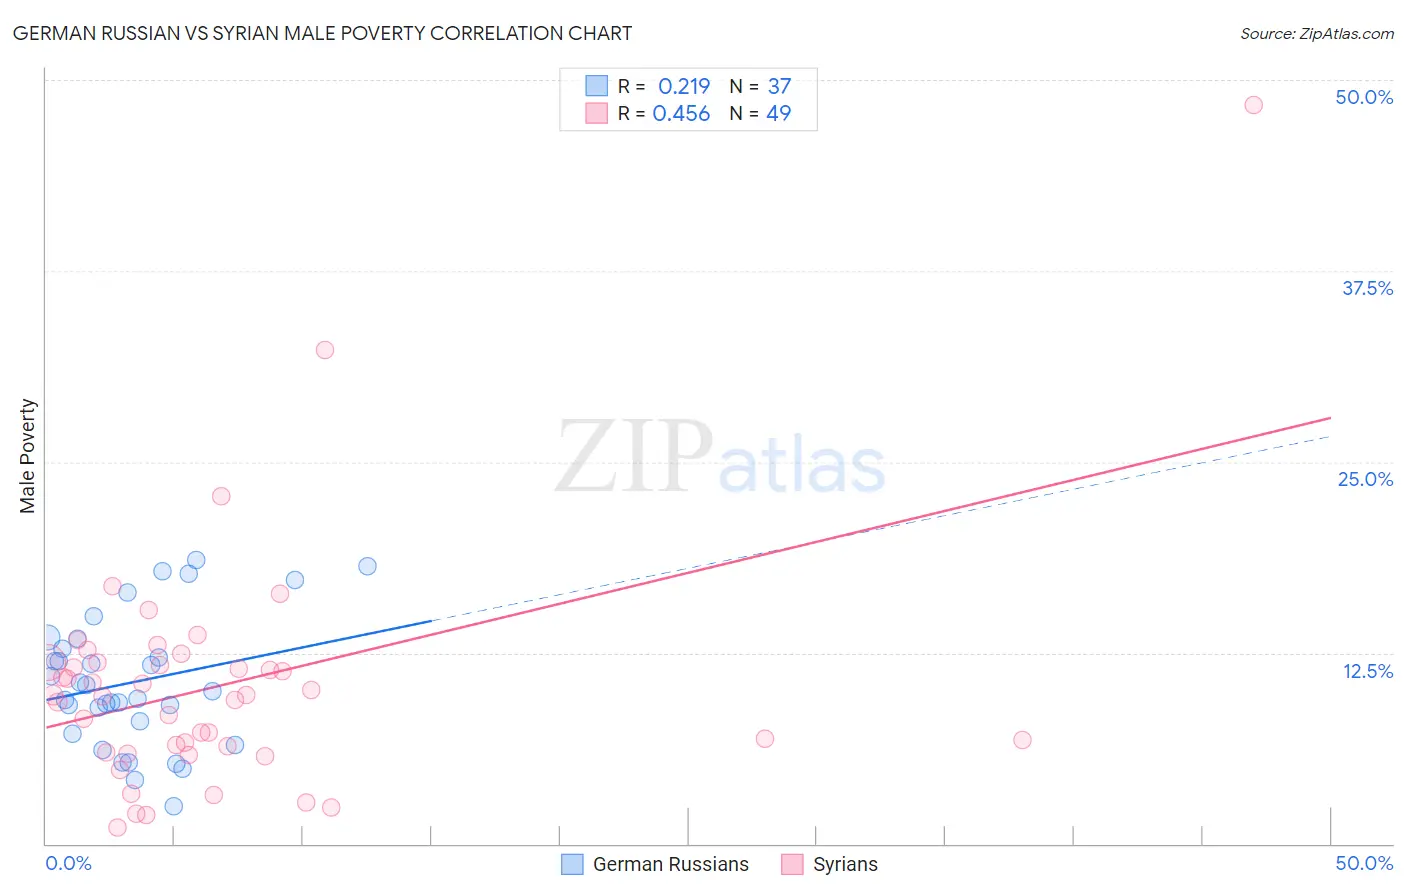
German Russian vs Syrian Male Poverty Correlation Chart
The statistical analysis conducted on geographies consisting of 96,430,864 people shows a weak positive correlation between the proportion of German Russians and poverty level among males in the United States with a correlation coefficient (R) of 0.219 and weighted average of 12.2%. Similarly, the statistical analysis conducted on geographies consisting of 266,155,974 people shows a moderate positive correlation between the proportion of Syrians and poverty level among males in the United States with a correlation coefficient (R) of 0.456 and weighted average of 10.9%, a difference of 11.5%.
Male Poverty Correlation Summary
| Measurement | German Russian | Syrian |
| Minimum | 2.5% | 1.0% |
| Maximum | 18.6% | 48.3% |
| Range | 16.2% | 47.3% |
| Mean | 10.6% | 10.4% |
| Median | 10.0% | 9.7% |
| Interquartile 25% (IQ1) | 7.6% | 6.2% |
| Interquartile 75% (IQ3) | 13.1% | 11.8% |
| Interquartile Range (IQR) | 5.5% | 5.7% |
| Standard Deviation (Sample) | 4.2% | 7.8% |
| Standard Deviation (Population) | 4.2% | 7.7% |
Similar Demographics by Male Poverty
Demographics Similar to German Russians by Male Poverty
In terms of male poverty, the demographic groups most similar to German Russians are Immigrants from Thailand (12.2%, a difference of 0.020%), Immigrants from Cambodia (12.2%, a difference of 0.030%), Bermudan (12.2%, a difference of 0.070%), Immigrants from Eritrea (12.2%, a difference of 0.080%), and Immigrants from Uzbekistan (12.2%, a difference of 0.11%).
| Demographics | Rating | Rank | Male Poverty |
| Immigrants | Panama | 4.0 /100 | #211 | Tragic 12.1% |
| Americans | 3.2 /100 | #212 | Tragic 12.1% |
| Immigrants | Nonimmigrants | 3.1 /100 | #213 | Tragic 12.1% |
| Japanese | 2.7 /100 | #214 | Tragic 12.2% |
| Immigrants | Uzbekistan | 2.6 /100 | #215 | Tragic 12.2% |
| Immigrants | Cambodia | 2.5 /100 | #216 | Tragic 12.2% |
| Immigrants | Thailand | 2.5 /100 | #217 | Tragic 12.2% |
| German Russians | 2.5 /100 | #218 | Tragic 12.2% |
| Bermudans | 2.4 /100 | #219 | Tragic 12.2% |
| Immigrants | Eritrea | 2.4 /100 | #220 | Tragic 12.2% |
| Ugandans | 2.2 /100 | #221 | Tragic 12.2% |
| Immigrants | Africa | 2.1 /100 | #222 | Tragic 12.2% |
| Immigrants | Micronesia | 2.1 /100 | #223 | Tragic 12.2% |
| Immigrants | Nigeria | 1.6 /100 | #224 | Tragic 12.3% |
| Osage | 1.5 /100 | #225 | Tragic 12.3% |
Demographics Similar to Syrians by Male Poverty
In terms of male poverty, the demographic groups most similar to Syrians are Immigrants from Germany (10.9%, a difference of 0.030%), Samoan (10.9%, a difference of 0.050%), Afghan (10.9%, a difference of 0.070%), Icelander (11.0%, a difference of 0.34%), and Armenian (11.0%, a difference of 0.40%).
| Demographics | Rating | Rank | Male Poverty |
| Immigrants | Jordan | 77.5 /100 | #139 | Good 10.8% |
| Tlingit-Haida | 76.1 /100 | #140 | Good 10.9% |
| Immigrants | France | 75.8 /100 | #141 | Good 10.9% |
| Basques | 74.6 /100 | #142 | Good 10.9% |
| Afghans | 71.9 /100 | #143 | Good 10.9% |
| Samoans | 71.8 /100 | #144 | Good 10.9% |
| Immigrants | Germany | 71.6 /100 | #145 | Good 10.9% |
| Syrians | 71.4 /100 | #146 | Good 10.9% |
| Icelanders | 68.5 /100 | #147 | Good 11.0% |
| Armenians | 68.0 /100 | #148 | Good 11.0% |
| Immigrants | Venezuela | 67.9 /100 | #149 | Good 11.0% |
| Guamanians/Chamorros | 67.6 /100 | #150 | Good 11.0% |
| Venezuelans | 67.4 /100 | #151 | Good 11.0% |
| Immigrants | Nepal | 67.3 /100 | #152 | Good 11.0% |
| Immigrants | Bosnia and Herzegovina | 65.2 /100 | #153 | Good 11.0% |