German Russian vs Immigrants from South Africa Male Poverty
COMPARE
German Russian
Immigrants from South Africa
Male Poverty
Male Poverty Comparison
German Russians
Immigrants from South Africa
12.2%
MALE POVERTY
2.5/ 100
METRIC RATING
218th/ 347
METRIC RANK
10.4%
MALE POVERTY
94.1/ 100
METRIC RATING
94th/ 347
METRIC RANK
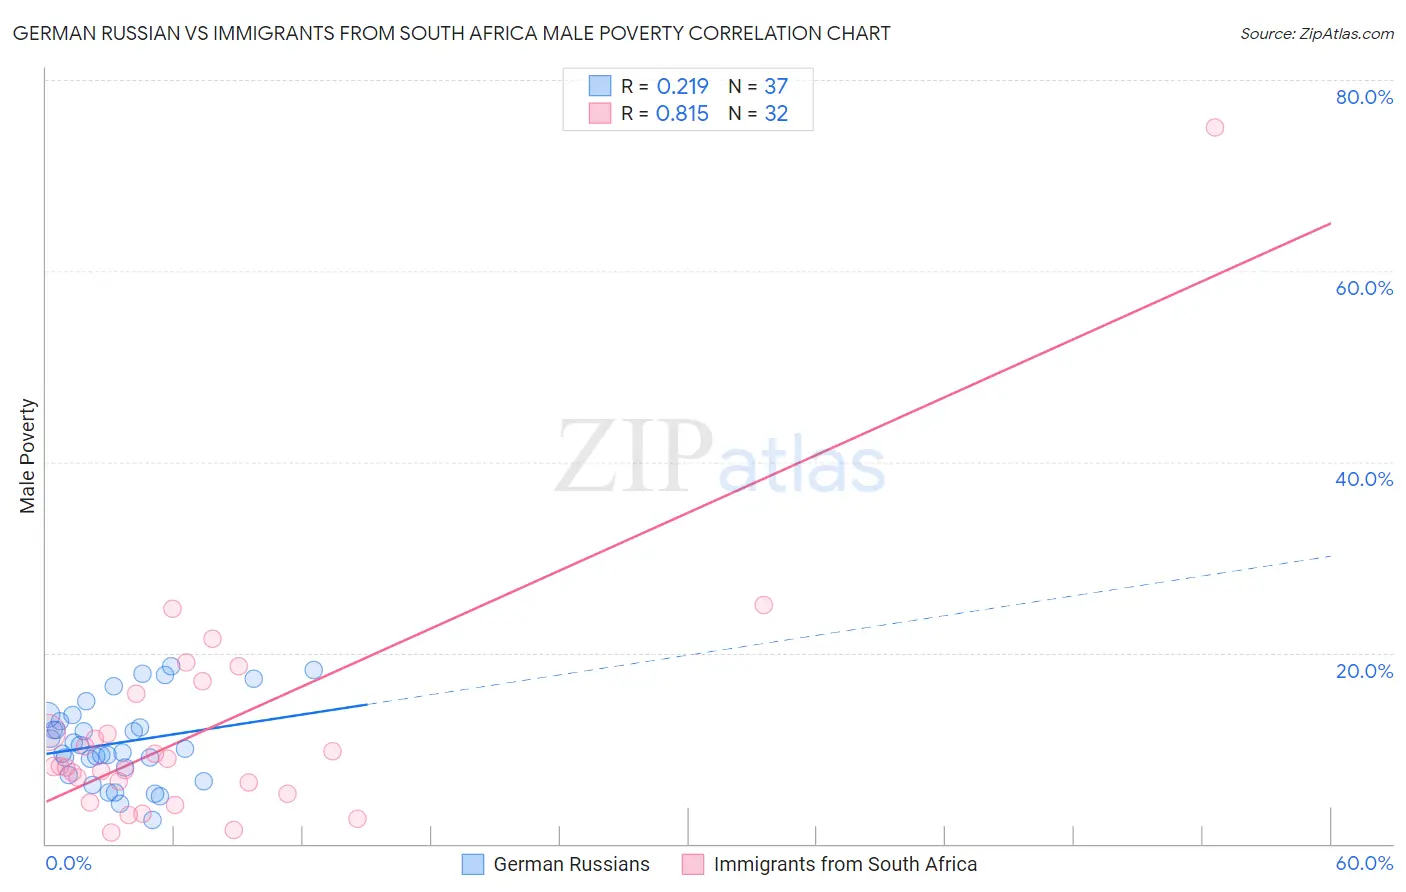
German Russian vs Immigrants from South Africa Male Poverty Correlation Chart
The statistical analysis conducted on geographies consisting of 96,430,864 people shows a weak positive correlation between the proportion of German Russians and poverty level among males in the United States with a correlation coefficient (R) of 0.219 and weighted average of 12.2%. Similarly, the statistical analysis conducted on geographies consisting of 233,179,579 people shows a very strong positive correlation between the proportion of Immigrants from South Africa and poverty level among males in the United States with a correlation coefficient (R) of 0.815 and weighted average of 10.4%, a difference of 16.9%.
Male Poverty Correlation Summary
| Measurement | German Russian | Immigrants from South Africa |
| Minimum | 2.5% | 1.1% |
| Maximum | 18.6% | 75.0% |
| Range | 16.2% | 73.9% |
| Mean | 10.6% | 11.9% |
| Median | 10.0% | 8.1% |
| Interquartile 25% (IQ1) | 7.6% | 5.8% |
| Interquartile 75% (IQ3) | 13.1% | 13.7% |
| Interquartile Range (IQR) | 5.5% | 7.8% |
| Standard Deviation (Sample) | 4.2% | 13.2% |
| Standard Deviation (Population) | 4.2% | 13.0% |
Similar Demographics by Male Poverty
Demographics Similar to German Russians by Male Poverty
In terms of male poverty, the demographic groups most similar to German Russians are Immigrants from Thailand (12.2%, a difference of 0.020%), Immigrants from Cambodia (12.2%, a difference of 0.030%), Bermudan (12.2%, a difference of 0.070%), Immigrants from Eritrea (12.2%, a difference of 0.080%), and Immigrants from Uzbekistan (12.2%, a difference of 0.11%).
| Demographics | Rating | Rank | Male Poverty |
| Immigrants | Panama | 4.0 /100 | #211 | Tragic 12.1% |
| Americans | 3.2 /100 | #212 | Tragic 12.1% |
| Immigrants | Nonimmigrants | 3.1 /100 | #213 | Tragic 12.1% |
| Japanese | 2.7 /100 | #214 | Tragic 12.2% |
| Immigrants | Uzbekistan | 2.6 /100 | #215 | Tragic 12.2% |
| Immigrants | Cambodia | 2.5 /100 | #216 | Tragic 12.2% |
| Immigrants | Thailand | 2.5 /100 | #217 | Tragic 12.2% |
| German Russians | 2.5 /100 | #218 | Tragic 12.2% |
| Bermudans | 2.4 /100 | #219 | Tragic 12.2% |
| Immigrants | Eritrea | 2.4 /100 | #220 | Tragic 12.2% |
| Ugandans | 2.2 /100 | #221 | Tragic 12.2% |
| Immigrants | Africa | 2.1 /100 | #222 | Tragic 12.2% |
| Immigrants | Micronesia | 2.1 /100 | #223 | Tragic 12.2% |
| Immigrants | Nigeria | 1.6 /100 | #224 | Tragic 12.3% |
| Osage | 1.5 /100 | #225 | Tragic 12.3% |
Demographics Similar to Immigrants from South Africa by Male Poverty
In terms of male poverty, the demographic groups most similar to Immigrants from South Africa are Scottish (10.4%, a difference of 0.030%), Immigrants from Egypt (10.4%, a difference of 0.16%), Jordanian (10.4%, a difference of 0.17%), Australian (10.4%, a difference of 0.17%), and Romanian (10.5%, a difference of 0.22%).
| Demographics | Rating | Rank | Male Poverty |
| Northern Europeans | 95.2 /100 | #87 | Exceptional 10.4% |
| Cambodians | 95.0 /100 | #88 | Exceptional 10.4% |
| Immigrants | Denmark | 95.0 /100 | #89 | Exceptional 10.4% |
| Indians (Asian) | 94.9 /100 | #90 | Exceptional 10.4% |
| British | 94.8 /100 | #91 | Exceptional 10.4% |
| Jordanians | 94.4 /100 | #92 | Exceptional 10.4% |
| Australians | 94.4 /100 | #93 | Exceptional 10.4% |
| Immigrants | South Africa | 94.1 /100 | #94 | Exceptional 10.4% |
| Scottish | 94.0 /100 | #95 | Exceptional 10.4% |
| Immigrants | Egypt | 93.7 /100 | #96 | Exceptional 10.4% |
| Romanians | 93.6 /100 | #97 | Exceptional 10.5% |
| Finns | 93.4 /100 | #98 | Exceptional 10.5% |
| Immigrants | Indonesia | 93.3 /100 | #99 | Exceptional 10.5% |
| Immigrants | Latvia | 92.8 /100 | #100 | Exceptional 10.5% |
| Immigrants | Zimbabwe | 92.0 /100 | #101 | Exceptional 10.5% |