German Russian vs Jordanian Male Poverty
COMPARE
German Russian
Jordanian
Male Poverty
Male Poverty Comparison
German Russians
Jordanians
12.2%
MALE POVERTY
2.5/ 100
METRIC RATING
218th/ 347
METRIC RANK
10.4%
MALE POVERTY
94.4/ 100
METRIC RATING
92nd/ 347
METRIC RANK
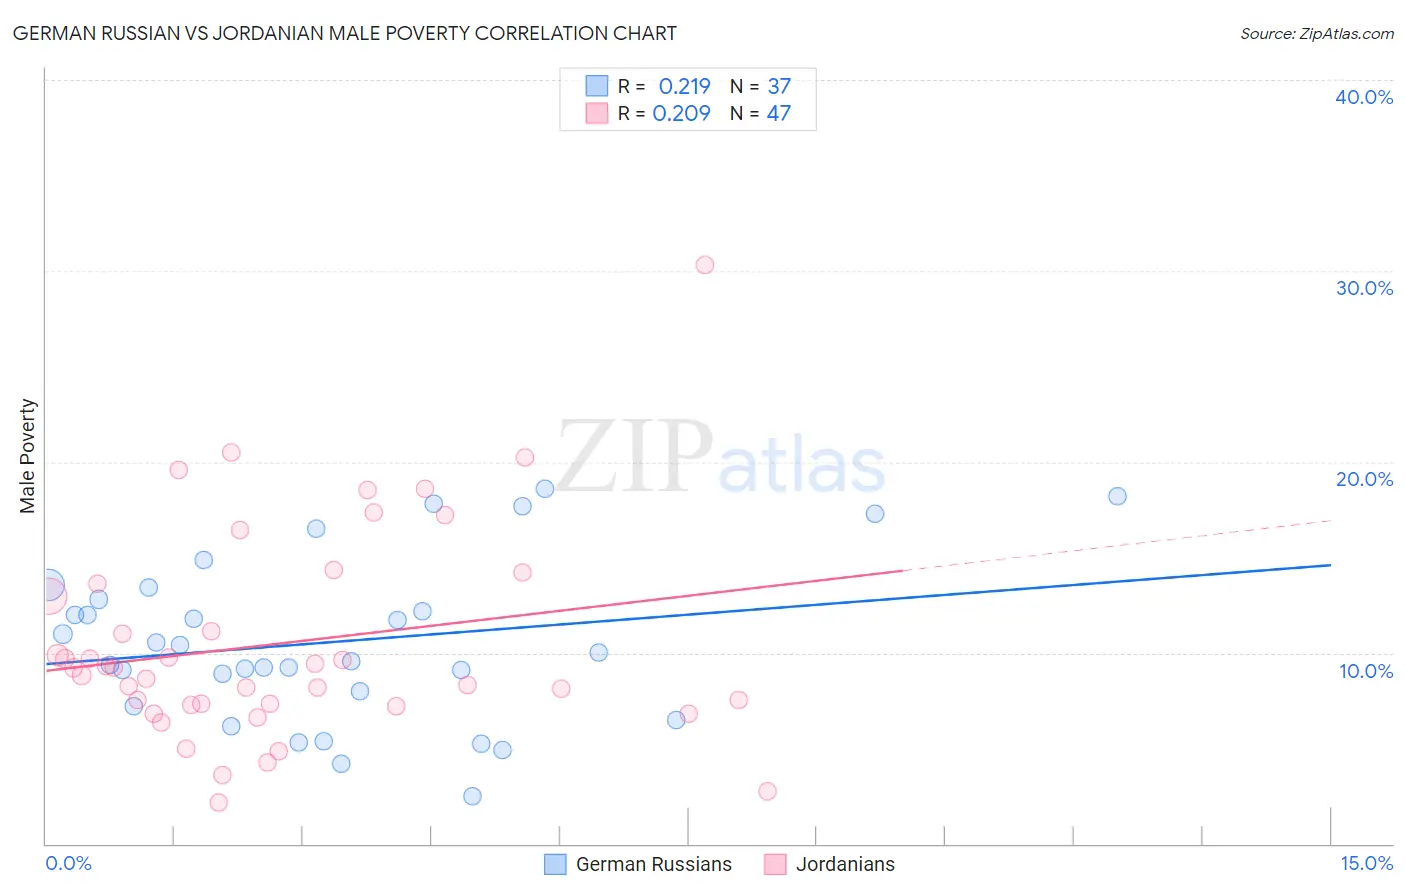
German Russian vs Jordanian Male Poverty Correlation Chart
The statistical analysis conducted on geographies consisting of 96,430,864 people shows a weak positive correlation between the proportion of German Russians and poverty level among males in the United States with a correlation coefficient (R) of 0.219 and weighted average of 12.2%. Similarly, the statistical analysis conducted on geographies consisting of 166,386,715 people shows a weak positive correlation between the proportion of Jordanians and poverty level among males in the United States with a correlation coefficient (R) of 0.209 and weighted average of 10.4%, a difference of 17.1%.
Male Poverty Correlation Summary
| Measurement | German Russian | Jordanian |
| Minimum | 2.5% | 2.1% |
| Maximum | 18.6% | 30.3% |
| Range | 16.2% | 28.2% |
| Mean | 10.6% | 10.5% |
| Median | 10.0% | 9.2% |
| Interquartile 25% (IQ1) | 7.6% | 7.3% |
| Interquartile 75% (IQ3) | 13.1% | 13.6% |
| Interquartile Range (IQR) | 5.5% | 6.4% |
| Standard Deviation (Sample) | 4.2% | 5.5% |
| Standard Deviation (Population) | 4.2% | 5.5% |
Similar Demographics by Male Poverty
Demographics Similar to German Russians by Male Poverty
In terms of male poverty, the demographic groups most similar to German Russians are Immigrants from Thailand (12.2%, a difference of 0.020%), Immigrants from Cambodia (12.2%, a difference of 0.030%), Bermudan (12.2%, a difference of 0.070%), Immigrants from Eritrea (12.2%, a difference of 0.080%), and Immigrants from Uzbekistan (12.2%, a difference of 0.11%).
| Demographics | Rating | Rank | Male Poverty |
| Immigrants | Panama | 4.0 /100 | #211 | Tragic 12.1% |
| Americans | 3.2 /100 | #212 | Tragic 12.1% |
| Immigrants | Nonimmigrants | 3.1 /100 | #213 | Tragic 12.1% |
| Japanese | 2.7 /100 | #214 | Tragic 12.2% |
| Immigrants | Uzbekistan | 2.6 /100 | #215 | Tragic 12.2% |
| Immigrants | Cambodia | 2.5 /100 | #216 | Tragic 12.2% |
| Immigrants | Thailand | 2.5 /100 | #217 | Tragic 12.2% |
| German Russians | 2.5 /100 | #218 | Tragic 12.2% |
| Bermudans | 2.4 /100 | #219 | Tragic 12.2% |
| Immigrants | Eritrea | 2.4 /100 | #220 | Tragic 12.2% |
| Ugandans | 2.2 /100 | #221 | Tragic 12.2% |
| Immigrants | Africa | 2.1 /100 | #222 | Tragic 12.2% |
| Immigrants | Micronesia | 2.1 /100 | #223 | Tragic 12.2% |
| Immigrants | Nigeria | 1.6 /100 | #224 | Tragic 12.3% |
| Osage | 1.5 /100 | #225 | Tragic 12.3% |
Demographics Similar to Jordanians by Male Poverty
In terms of male poverty, the demographic groups most similar to Jordanians are Australian (10.4%, a difference of 0.0%), Immigrants from South Africa (10.4%, a difference of 0.17%), British (10.4%, a difference of 0.20%), Scottish (10.4%, a difference of 0.21%), and Indian (Asian) (10.4%, a difference of 0.27%).
| Demographics | Rating | Rank | Male Poverty |
| Immigrants | England | 95.5 /100 | #85 | Exceptional 10.4% |
| Immigrants | Eastern Asia | 95.3 /100 | #86 | Exceptional 10.4% |
| Northern Europeans | 95.2 /100 | #87 | Exceptional 10.4% |
| Cambodians | 95.0 /100 | #88 | Exceptional 10.4% |
| Immigrants | Denmark | 95.0 /100 | #89 | Exceptional 10.4% |
| Indians (Asian) | 94.9 /100 | #90 | Exceptional 10.4% |
| British | 94.8 /100 | #91 | Exceptional 10.4% |
| Jordanians | 94.4 /100 | #92 | Exceptional 10.4% |
| Australians | 94.4 /100 | #93 | Exceptional 10.4% |
| Immigrants | South Africa | 94.1 /100 | #94 | Exceptional 10.4% |
| Scottish | 94.0 /100 | #95 | Exceptional 10.4% |
| Immigrants | Egypt | 93.7 /100 | #96 | Exceptional 10.4% |
| Romanians | 93.6 /100 | #97 | Exceptional 10.5% |
| Finns | 93.4 /100 | #98 | Exceptional 10.5% |
| Immigrants | Indonesia | 93.3 /100 | #99 | Exceptional 10.5% |