German Russian vs Indonesian Male Poverty
COMPARE
German Russian
Indonesian
Male Poverty
Male Poverty Comparison
German Russians
Indonesians
12.2%
MALE POVERTY
2.5/ 100
METRIC RATING
218th/ 347
METRIC RANK
13.8%
MALE POVERTY
0.0/ 100
METRIC RATING
292nd/ 347
METRIC RANK
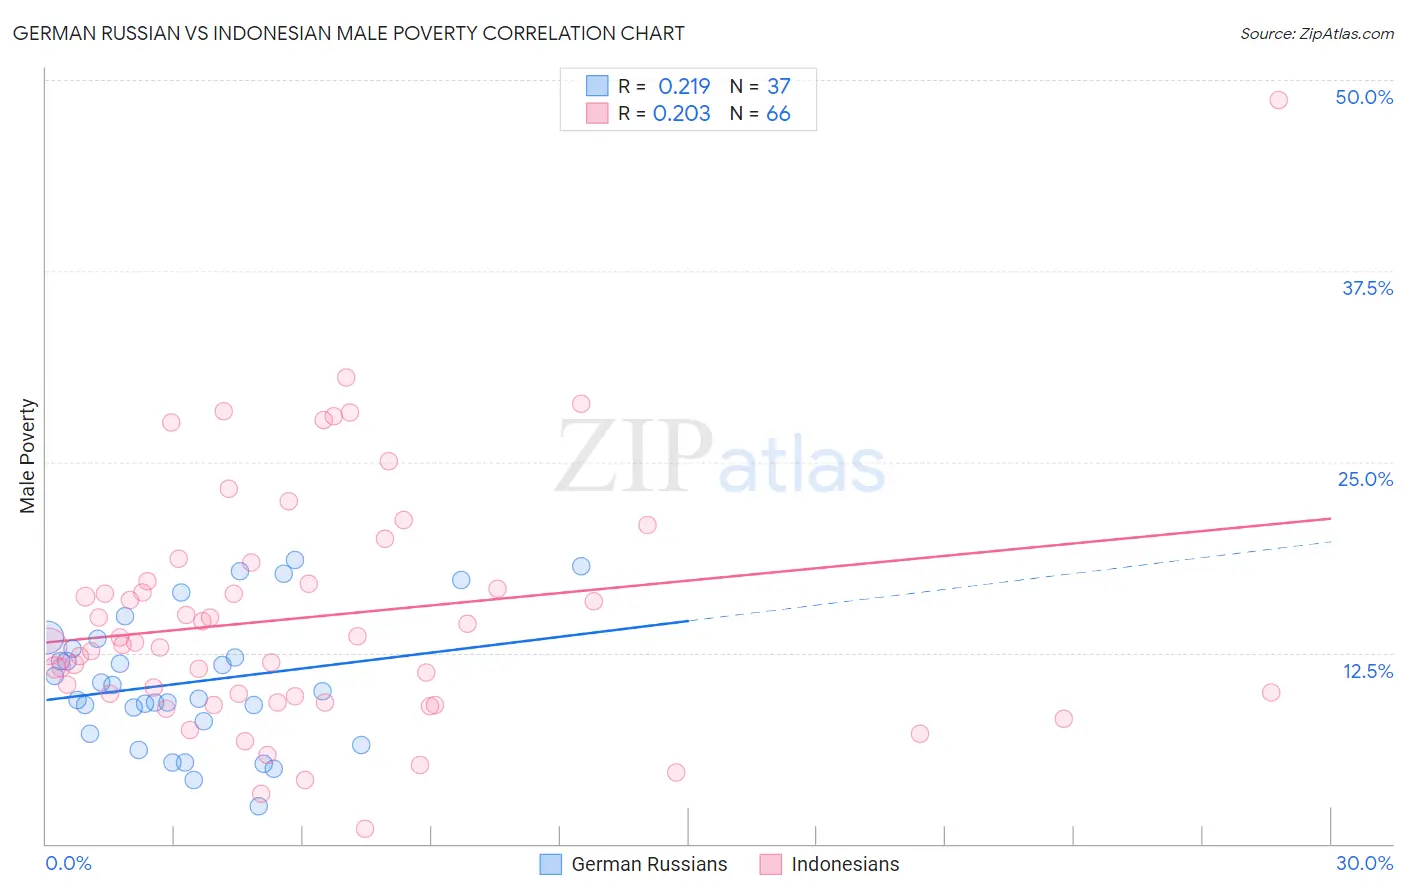
German Russian vs Indonesian Male Poverty Correlation Chart
The statistical analysis conducted on geographies consisting of 96,430,864 people shows a weak positive correlation between the proportion of German Russians and poverty level among males in the United States with a correlation coefficient (R) of 0.219 and weighted average of 12.2%. Similarly, the statistical analysis conducted on geographies consisting of 162,645,449 people shows a weak positive correlation between the proportion of Indonesians and poverty level among males in the United States with a correlation coefficient (R) of 0.203 and weighted average of 13.8%, a difference of 13.5%.
Male Poverty Correlation Summary
| Measurement | German Russian | Indonesian |
| Minimum | 2.5% | 1.0% |
| Maximum | 18.6% | 48.7% |
| Range | 16.2% | 47.6% |
| Mean | 10.6% | 14.9% |
| Median | 10.0% | 13.1% |
| Interquartile 25% (IQ1) | 7.6% | 9.6% |
| Interquartile 75% (IQ3) | 13.1% | 17.2% |
| Interquartile Range (IQR) | 5.5% | 7.5% |
| Standard Deviation (Sample) | 4.2% | 8.0% |
| Standard Deviation (Population) | 4.2% | 8.0% |
Similar Demographics by Male Poverty
Demographics Similar to German Russians by Male Poverty
In terms of male poverty, the demographic groups most similar to German Russians are Immigrants from Thailand (12.2%, a difference of 0.020%), Immigrants from Cambodia (12.2%, a difference of 0.030%), Bermudan (12.2%, a difference of 0.070%), Immigrants from Eritrea (12.2%, a difference of 0.080%), and Immigrants from Uzbekistan (12.2%, a difference of 0.11%).
| Demographics | Rating | Rank | Male Poverty |
| Immigrants | Panama | 4.0 /100 | #211 | Tragic 12.1% |
| Americans | 3.2 /100 | #212 | Tragic 12.1% |
| Immigrants | Nonimmigrants | 3.1 /100 | #213 | Tragic 12.1% |
| Japanese | 2.7 /100 | #214 | Tragic 12.2% |
| Immigrants | Uzbekistan | 2.6 /100 | #215 | Tragic 12.2% |
| Immigrants | Cambodia | 2.5 /100 | #216 | Tragic 12.2% |
| Immigrants | Thailand | 2.5 /100 | #217 | Tragic 12.2% |
| German Russians | 2.5 /100 | #218 | Tragic 12.2% |
| Bermudans | 2.4 /100 | #219 | Tragic 12.2% |
| Immigrants | Eritrea | 2.4 /100 | #220 | Tragic 12.2% |
| Ugandans | 2.2 /100 | #221 | Tragic 12.2% |
| Immigrants | Africa | 2.1 /100 | #222 | Tragic 12.2% |
| Immigrants | Micronesia | 2.1 /100 | #223 | Tragic 12.2% |
| Immigrants | Nigeria | 1.6 /100 | #224 | Tragic 12.3% |
| Osage | 1.5 /100 | #225 | Tragic 12.3% |
Demographics Similar to Indonesians by Male Poverty
In terms of male poverty, the demographic groups most similar to Indonesians are Immigrants from Belize (13.8%, a difference of 0.010%), Hispanic or Latino (13.9%, a difference of 0.070%), Vietnamese (13.8%, a difference of 0.17%), Guatemalan (13.8%, a difference of 0.26%), and Immigrants from Zaire (13.8%, a difference of 0.26%).
| Demographics | Rating | Rank | Male Poverty |
| West Indians | 0.0 /100 | #285 | Tragic 13.8% |
| Shoshone | 0.0 /100 | #286 | Tragic 13.8% |
| Immigrants | Barbados | 0.0 /100 | #287 | Tragic 13.8% |
| Immigrants | St. Vincent and the Grenadines | 0.0 /100 | #288 | Tragic 13.8% |
| Guatemalans | 0.0 /100 | #289 | Tragic 13.8% |
| Immigrants | Zaire | 0.0 /100 | #290 | Tragic 13.8% |
| Vietnamese | 0.0 /100 | #291 | Tragic 13.8% |
| Indonesians | 0.0 /100 | #292 | Tragic 13.8% |
| Immigrants | Belize | 0.0 /100 | #293 | Tragic 13.8% |
| Hispanics or Latinos | 0.0 /100 | #294 | Tragic 13.9% |
| Immigrants | Central America | 0.0 /100 | #295 | Tragic 13.9% |
| Cajuns | 0.0 /100 | #296 | Tragic 13.9% |
| Inupiat | 0.0 /100 | #297 | Tragic 14.0% |
| Blackfeet | 0.0 /100 | #298 | Tragic 14.0% |
| Immigrants | Guatemala | 0.0 /100 | #299 | Tragic 14.0% |