Finnish vs Immigrants from Sudan Receiving Food Stamps
COMPARE
Finnish
Immigrants from Sudan
Receiving Food Stamps
Receiving Food Stamps Comparison
Finns
Immigrants from Sudan
10.2%
RECEIVING FOOD STAMPS
97.9/ 100
METRIC RATING
90th/ 347
METRIC RANK
12.1%
RECEIVING FOOD STAMPS
27.1/ 100
METRIC RATING
194th/ 347
METRIC RANK
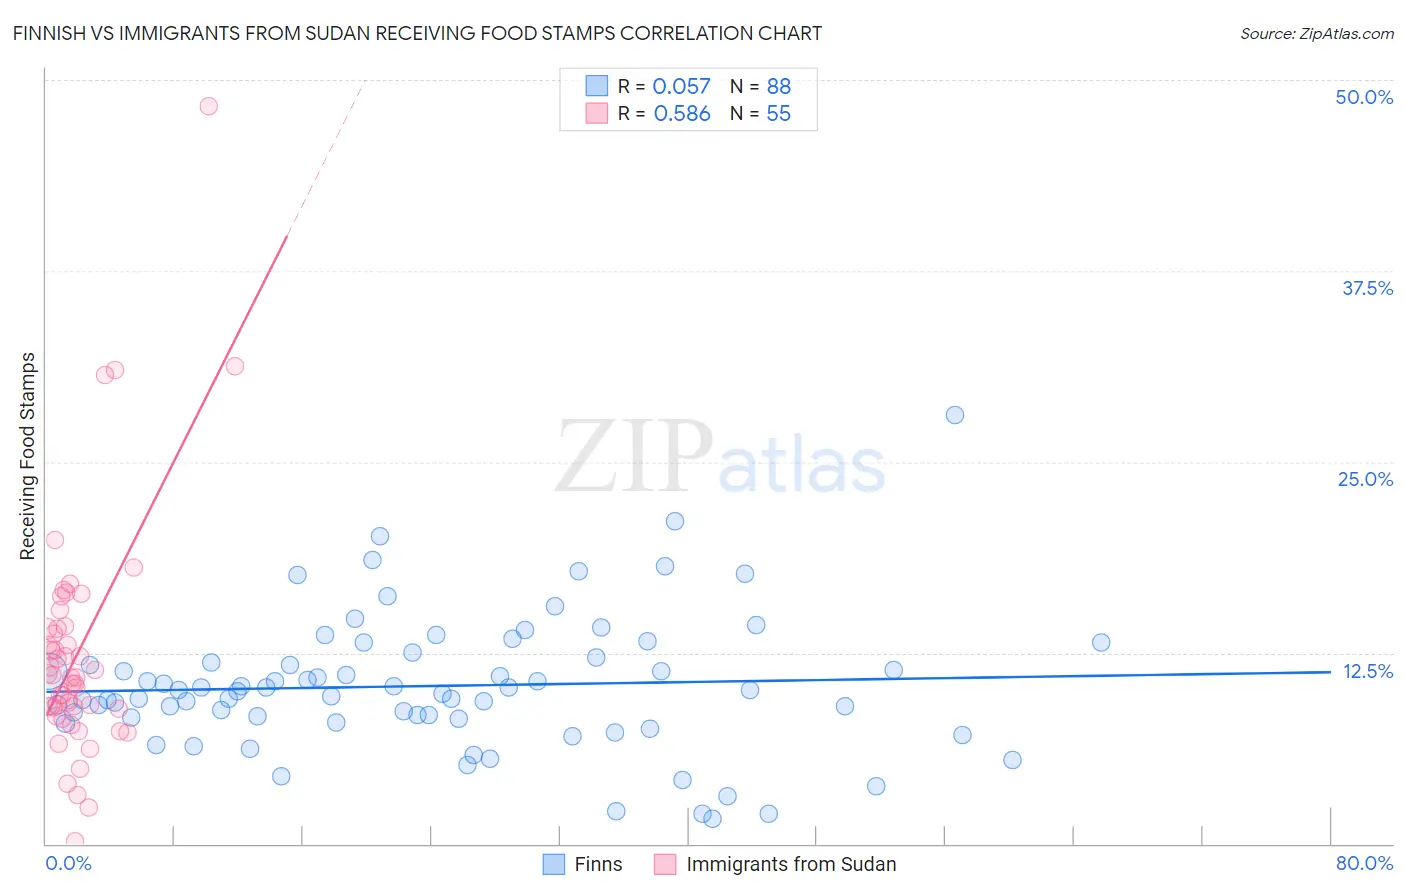
Finnish vs Immigrants from Sudan Receiving Food Stamps Correlation Chart
The statistical analysis conducted on geographies consisting of 403,543,220 people shows a slight positive correlation between the proportion of Finns and percentage of population receiving government assistance and/or food stamps in the United States with a correlation coefficient (R) of 0.057 and weighted average of 10.2%. Similarly, the statistical analysis conducted on geographies consisting of 118,933,467 people shows a substantial positive correlation between the proportion of Immigrants from Sudan and percentage of population receiving government assistance and/or food stamps in the United States with a correlation coefficient (R) of 0.586 and weighted average of 12.1%, a difference of 19.6%.
Receiving Food Stamps Correlation Summary
| Measurement | Finnish | Immigrants from Sudan |
| Minimum | 1.6% | 0.20% |
| Maximum | 28.1% | 48.3% |
| Range | 26.5% | 48.1% |
| Mean | 10.3% | 12.5% |
| Median | 10.0% | 10.9% |
| Interquartile 25% (IQ1) | 8.2% | 8.8% |
| Interquartile 75% (IQ3) | 12.0% | 14.1% |
| Interquartile Range (IQR) | 3.8% | 5.3% |
| Standard Deviation (Sample) | 4.4% | 7.8% |
| Standard Deviation (Population) | 4.4% | 7.8% |
Similar Demographics by Receiving Food Stamps
Demographics Similar to Finns by Receiving Food Stamps
In terms of receiving food stamps, the demographic groups most similar to Finns are Jordanian (10.2%, a difference of 0.040%), Irish (10.2%, a difference of 0.040%), Belgian (10.2%, a difference of 0.42%), Immigrants from France (10.1%, a difference of 0.85%), and Immigrants from Greece (10.3%, a difference of 0.95%).
| Demographics | Rating | Rank | Receiving Food Stamps |
| Dutch | 98.6 /100 | #83 | Exceptional 10.0% |
| Immigrants | Israel | 98.5 /100 | #84 | Exceptional 10.0% |
| Immigrants | Romania | 98.5 /100 | #85 | Exceptional 10.0% |
| Immigrants | Norway | 98.4 /100 | #86 | Exceptional 10.0% |
| Egyptians | 98.4 /100 | #87 | Exceptional 10.0% |
| Immigrants | Kuwait | 98.4 /100 | #88 | Exceptional 10.0% |
| Immigrants | France | 98.3 /100 | #89 | Exceptional 10.1% |
| Finns | 97.9 /100 | #90 | Exceptional 10.2% |
| Jordanians | 97.9 /100 | #91 | Exceptional 10.2% |
| Irish | 97.9 /100 | #92 | Exceptional 10.2% |
| Belgians | 97.7 /100 | #93 | Exceptional 10.2% |
| Immigrants | Greece | 97.4 /100 | #94 | Exceptional 10.3% |
| Basques | 97.4 /100 | #95 | Exceptional 10.3% |
| Welsh | 97.3 /100 | #96 | Exceptional 10.3% |
| Czechoslovakians | 97.2 /100 | #97 | Exceptional 10.3% |
Demographics Similar to Immigrants from Sudan by Receiving Food Stamps
In terms of receiving food stamps, the demographic groups most similar to Immigrants from Sudan are American (12.2%, a difference of 0.060%), Iraqi (12.2%, a difference of 0.090%), Immigrants from Fiji (12.1%, a difference of 0.12%), Delaware (12.2%, a difference of 0.17%), and Immigrants from Costa Rica (12.2%, a difference of 0.30%).
| Demographics | Rating | Rank | Receiving Food Stamps |
| Albanians | 35.4 /100 | #187 | Fair 12.0% |
| Sudanese | 33.4 /100 | #188 | Fair 12.0% |
| Immigrants | Cameroon | 32.5 /100 | #189 | Fair 12.0% |
| Immigrants | Peru | 32.2 /100 | #190 | Fair 12.0% |
| Venezuelans | 32.1 /100 | #191 | Fair 12.0% |
| Samoans | 31.0 /100 | #192 | Fair 12.1% |
| Immigrants | Fiji | 27.8 /100 | #193 | Fair 12.1% |
| Immigrants | Sudan | 27.1 /100 | #194 | Fair 12.1% |
| Americans | 26.7 /100 | #195 | Fair 12.2% |
| Iraqis | 26.6 /100 | #196 | Fair 12.2% |
| Delaware | 26.1 /100 | #197 | Fair 12.2% |
| Immigrants | Costa Rica | 25.4 /100 | #198 | Fair 12.2% |
| Portuguese | 25.1 /100 | #199 | Fair 12.2% |
| Sierra Leoneans | 23.6 /100 | #200 | Fair 12.2% |
| Ugandans | 22.5 /100 | #201 | Fair 12.2% |