Finnish vs Haitian Receiving Food Stamps
COMPARE
Finnish
Haitian
Receiving Food Stamps
Receiving Food Stamps Comparison
Finns
Haitians
10.2%
RECEIVING FOOD STAMPS
97.9/ 100
METRIC RATING
90th/ 347
METRIC RANK
17.8%
RECEIVING FOOD STAMPS
0.0/ 100
METRIC RATING
323rd/ 347
METRIC RANK
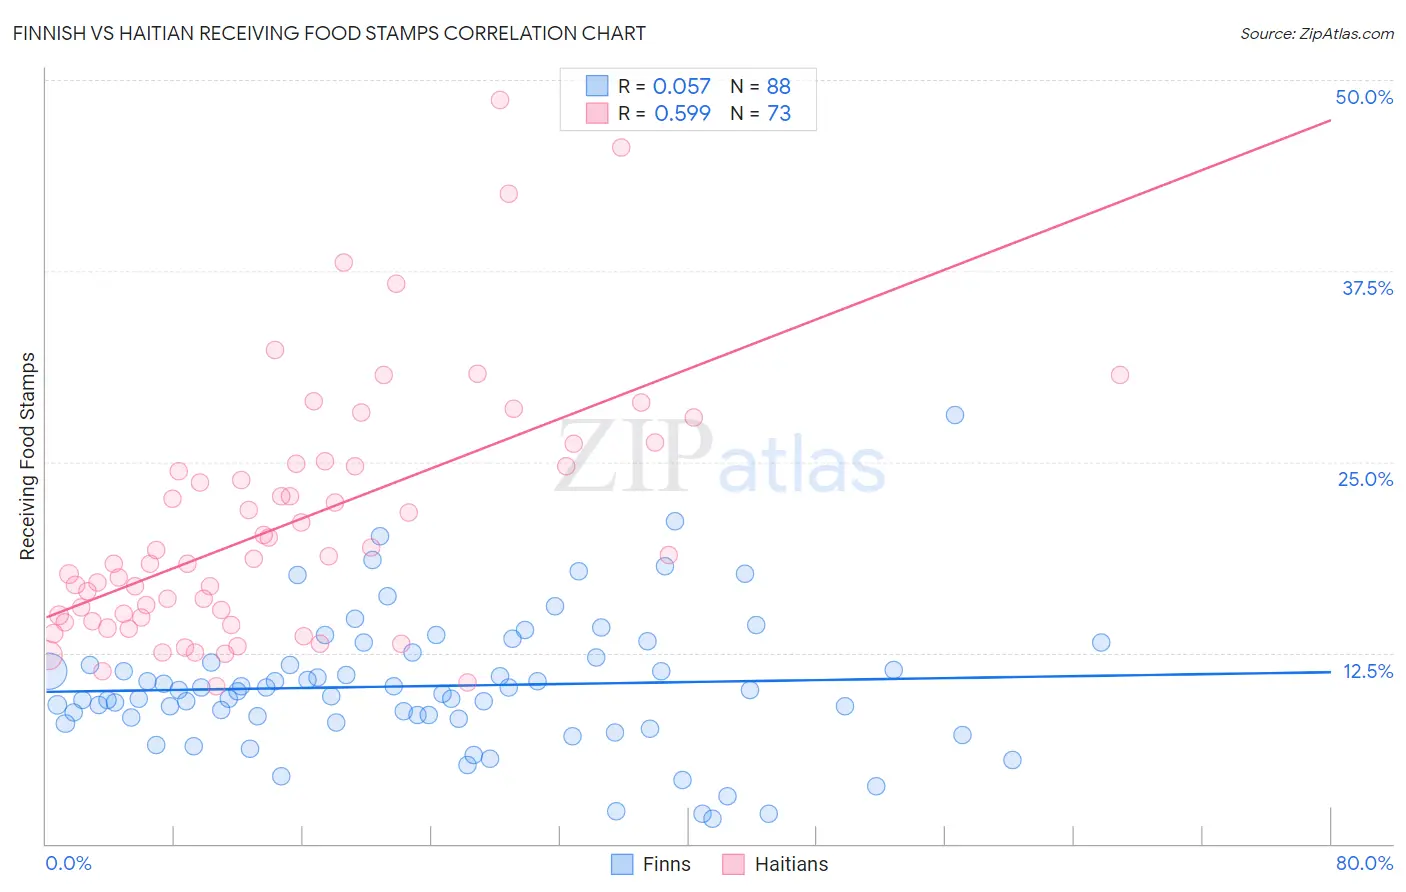
Finnish vs Haitian Receiving Food Stamps Correlation Chart
The statistical analysis conducted on geographies consisting of 403,543,220 people shows a slight positive correlation between the proportion of Finns and percentage of population receiving government assistance and/or food stamps in the United States with a correlation coefficient (R) of 0.057 and weighted average of 10.2%. Similarly, the statistical analysis conducted on geographies consisting of 287,415,058 people shows a substantial positive correlation between the proportion of Haitians and percentage of population receiving government assistance and/or food stamps in the United States with a correlation coefficient (R) of 0.599 and weighted average of 17.8%, a difference of 75.1%.
Receiving Food Stamps Correlation Summary
| Measurement | Finnish | Haitian |
| Minimum | 1.6% | 10.3% |
| Maximum | 28.1% | 48.7% |
| Range | 26.5% | 38.4% |
| Mean | 10.3% | 20.9% |
| Median | 10.0% | 18.7% |
| Interquartile 25% (IQ1) | 8.2% | 14.7% |
| Interquartile 75% (IQ3) | 12.0% | 24.8% |
| Interquartile Range (IQR) | 3.8% | 10.1% |
| Standard Deviation (Sample) | 4.4% | 8.2% |
| Standard Deviation (Population) | 4.4% | 8.1% |
Similar Demographics by Receiving Food Stamps
Demographics Similar to Finns by Receiving Food Stamps
In terms of receiving food stamps, the demographic groups most similar to Finns are Jordanian (10.2%, a difference of 0.040%), Irish (10.2%, a difference of 0.040%), Belgian (10.2%, a difference of 0.42%), Immigrants from France (10.1%, a difference of 0.85%), and Immigrants from Greece (10.3%, a difference of 0.95%).
| Demographics | Rating | Rank | Receiving Food Stamps |
| Dutch | 98.6 /100 | #83 | Exceptional 10.0% |
| Immigrants | Israel | 98.5 /100 | #84 | Exceptional 10.0% |
| Immigrants | Romania | 98.5 /100 | #85 | Exceptional 10.0% |
| Immigrants | Norway | 98.4 /100 | #86 | Exceptional 10.0% |
| Egyptians | 98.4 /100 | #87 | Exceptional 10.0% |
| Immigrants | Kuwait | 98.4 /100 | #88 | Exceptional 10.0% |
| Immigrants | France | 98.3 /100 | #89 | Exceptional 10.1% |
| Finns | 97.9 /100 | #90 | Exceptional 10.2% |
| Jordanians | 97.9 /100 | #91 | Exceptional 10.2% |
| Irish | 97.9 /100 | #92 | Exceptional 10.2% |
| Belgians | 97.7 /100 | #93 | Exceptional 10.2% |
| Immigrants | Greece | 97.4 /100 | #94 | Exceptional 10.3% |
| Basques | 97.4 /100 | #95 | Exceptional 10.3% |
| Welsh | 97.3 /100 | #96 | Exceptional 10.3% |
| Czechoslovakians | 97.2 /100 | #97 | Exceptional 10.3% |
Demographics Similar to Haitians by Receiving Food Stamps
In terms of receiving food stamps, the demographic groups most similar to Haitians are Immigrants from Grenada (17.8%, a difference of 0.010%), British West Indian (17.9%, a difference of 0.59%), Immigrants from Haiti (18.2%, a difference of 2.4%), Cuban (18.2%, a difference of 2.5%), and Apache (18.3%, a difference of 2.8%).
| Demographics | Rating | Rank | Receiving Food Stamps |
| Central American Indians | 0.0 /100 | #316 | Tragic 17.1% |
| Blacks/African Americans | 0.0 /100 | #317 | Tragic 17.2% |
| Menominee | 0.0 /100 | #318 | Tragic 17.2% |
| Immigrants | St. Vincent and the Grenadines | 0.0 /100 | #319 | Tragic 17.2% |
| Immigrants | Nicaragua | 0.0 /100 | #320 | Tragic 17.2% |
| Natives/Alaskans | 0.0 /100 | #321 | Tragic 17.3% |
| Immigrants | Grenada | 0.0 /100 | #322 | Tragic 17.8% |
| Haitians | 0.0 /100 | #323 | Tragic 17.8% |
| British West Indians | 0.0 /100 | #324 | Tragic 17.9% |
| Immigrants | Haiti | 0.0 /100 | #325 | Tragic 18.2% |
| Cubans | 0.0 /100 | #326 | Tragic 18.2% |
| Apache | 0.0 /100 | #327 | Tragic 18.3% |
| Colville | 0.0 /100 | #328 | Tragic 18.3% |
| Immigrants | Dominica | 0.0 /100 | #329 | Tragic 18.4% |
| Pima | 0.0 /100 | #330 | Tragic 19.0% |