Finnish vs Puerto Rican Receiving Food Stamps
COMPARE
Finnish
Puerto Rican
Receiving Food Stamps
Receiving Food Stamps Comparison
Finns
Puerto Ricans
10.2%
RECEIVING FOOD STAMPS
97.9/ 100
METRIC RATING
90th/ 347
METRIC RANK
26.0%
RECEIVING FOOD STAMPS
0.0/ 100
METRIC RATING
346th/ 347
METRIC RANK
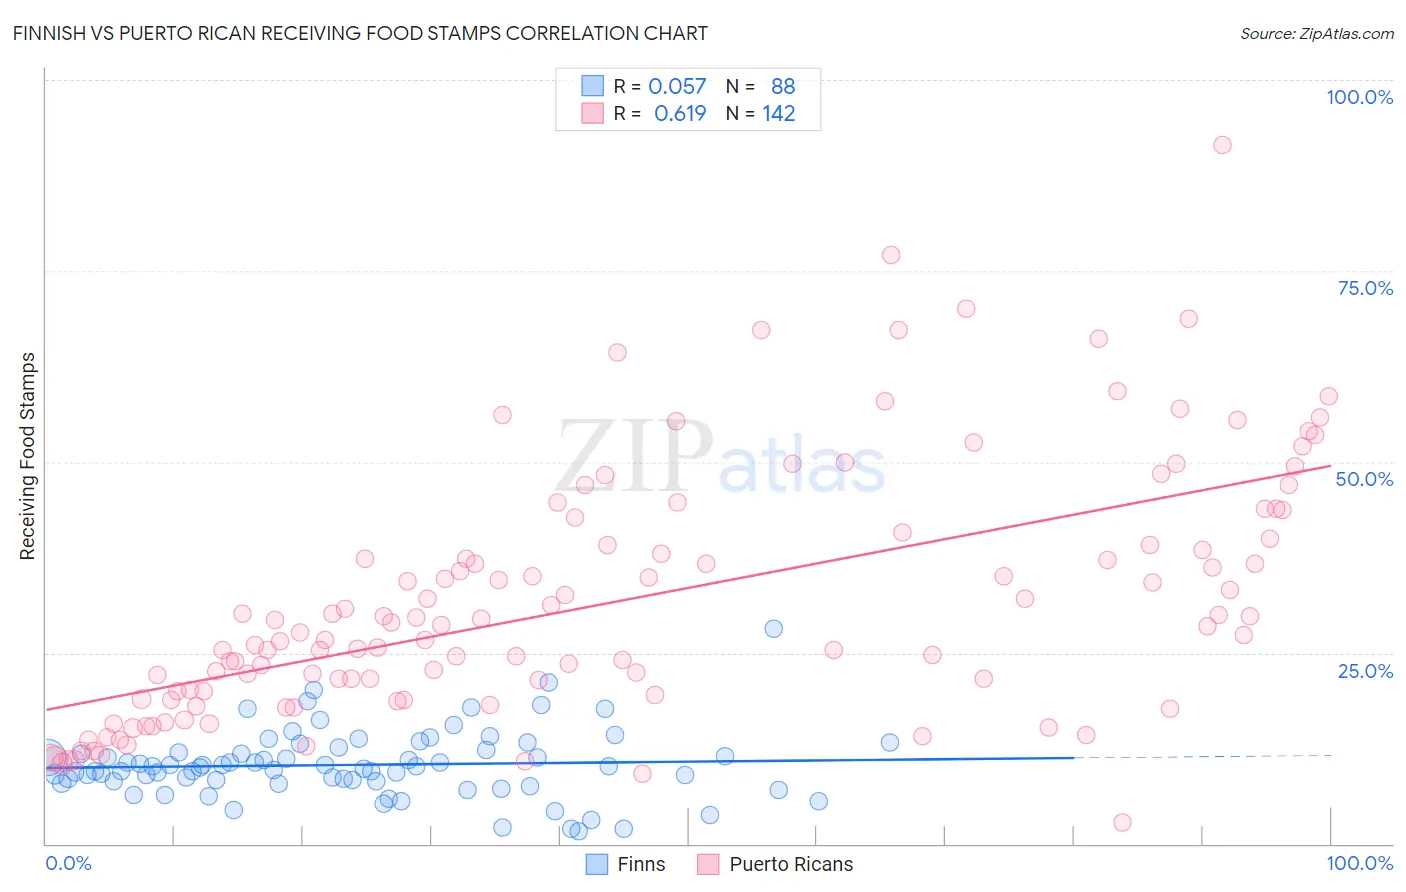
Finnish vs Puerto Rican Receiving Food Stamps Correlation Chart
The statistical analysis conducted on geographies consisting of 403,543,220 people shows a slight positive correlation between the proportion of Finns and percentage of population receiving government assistance and/or food stamps in the United States with a correlation coefficient (R) of 0.057 and weighted average of 10.2%. Similarly, the statistical analysis conducted on geographies consisting of 525,950,641 people shows a significant positive correlation between the proportion of Puerto Ricans and percentage of population receiving government assistance and/or food stamps in the United States with a correlation coefficient (R) of 0.619 and weighted average of 26.0%, a difference of 155.6%.
Receiving Food Stamps Correlation Summary
| Measurement | Finnish | Puerto Rican |
| Minimum | 1.6% | 2.8% |
| Maximum | 28.1% | 91.5% |
| Range | 26.5% | 88.7% |
| Mean | 10.3% | 31.7% |
| Median | 10.0% | 28.6% |
| Interquartile 25% (IQ1) | 8.2% | 19.5% |
| Interquartile 75% (IQ3) | 12.0% | 40.0% |
| Interquartile Range (IQR) | 3.8% | 20.5% |
| Standard Deviation (Sample) | 4.4% | 16.3% |
| Standard Deviation (Population) | 4.4% | 16.3% |
Similar Demographics by Receiving Food Stamps
Demographics Similar to Finns by Receiving Food Stamps
In terms of receiving food stamps, the demographic groups most similar to Finns are Jordanian (10.2%, a difference of 0.040%), Irish (10.2%, a difference of 0.040%), Belgian (10.2%, a difference of 0.42%), Immigrants from France (10.1%, a difference of 0.85%), and Immigrants from Greece (10.3%, a difference of 0.95%).
| Demographics | Rating | Rank | Receiving Food Stamps |
| Dutch | 98.6 /100 | #83 | Exceptional 10.0% |
| Immigrants | Israel | 98.5 /100 | #84 | Exceptional 10.0% |
| Immigrants | Romania | 98.5 /100 | #85 | Exceptional 10.0% |
| Immigrants | Norway | 98.4 /100 | #86 | Exceptional 10.0% |
| Egyptians | 98.4 /100 | #87 | Exceptional 10.0% |
| Immigrants | Kuwait | 98.4 /100 | #88 | Exceptional 10.0% |
| Immigrants | France | 98.3 /100 | #89 | Exceptional 10.1% |
| Finns | 97.9 /100 | #90 | Exceptional 10.2% |
| Jordanians | 97.9 /100 | #91 | Exceptional 10.2% |
| Irish | 97.9 /100 | #92 | Exceptional 10.2% |
| Belgians | 97.7 /100 | #93 | Exceptional 10.2% |
| Immigrants | Greece | 97.4 /100 | #94 | Exceptional 10.3% |
| Basques | 97.4 /100 | #95 | Exceptional 10.3% |
| Welsh | 97.3 /100 | #96 | Exceptional 10.3% |
| Czechoslovakians | 97.2 /100 | #97 | Exceptional 10.3% |
Demographics Similar to Puerto Ricans by Receiving Food Stamps
In terms of receiving food stamps, the demographic groups most similar to Puerto Ricans are Immigrants from Cabo Verde (23.8%, a difference of 8.9%), Lumbee (22.9%, a difference of 13.3%), Immigrants from Dominican Republic (22.1%, a difference of 17.3%), Immigrants from Yemen (21.6%, a difference of 20.0%), and Hopi (21.6%, a difference of 20.5%).
| Demographics | Rating | Rank | Receiving Food Stamps |
| Inupiat | 0.0 /100 | #333 | Tragic 20.1% |
| Yuman | 0.0 /100 | #334 | Tragic 20.2% |
| Immigrants | Cuba | 0.0 /100 | #335 | Tragic 20.8% |
| Navajo | 0.0 /100 | #336 | Tragic 21.1% |
| Cape Verdeans | 0.0 /100 | #337 | Tragic 21.1% |
| Dominicans | 0.0 /100 | #338 | Tragic 21.4% |
| Yakama | 0.0 /100 | #339 | Tragic 21.4% |
| Tohono O'odham | 0.0 /100 | #340 | Tragic 21.5% |
| Hopi | 0.0 /100 | #341 | Tragic 21.6% |
| Immigrants | Yemen | 0.0 /100 | #342 | Tragic 21.6% |
| Immigrants | Dominican Republic | 0.0 /100 | #343 | Tragic 22.1% |
| Lumbee | 0.0 /100 | #344 | Tragic 22.9% |
| Immigrants | Cabo Verde | 0.0 /100 | #345 | Tragic 23.8% |
| Puerto Ricans | 0.0 /100 | #346 | Tragic 26.0% |
| Yup'ik | 0.0 /100 | #347 | Tragic 32.7% |