Finnish vs Immigrants from Sudan In Labor Force | Age 30-34
COMPARE
Finnish
Immigrants from Sudan
In Labor Force | Age 30-34
In Labor Force | Age 30-34 Comparison
Finns
Immigrants from Sudan
84.7%
IN LABOR FORCE | AGE 30-34
50.0/ 100
METRIC RATING
174th/ 347
METRIC RANK
84.8%
IN LABOR FORCE | AGE 30-34
69.5/ 100
METRIC RATING
155th/ 347
METRIC RANK
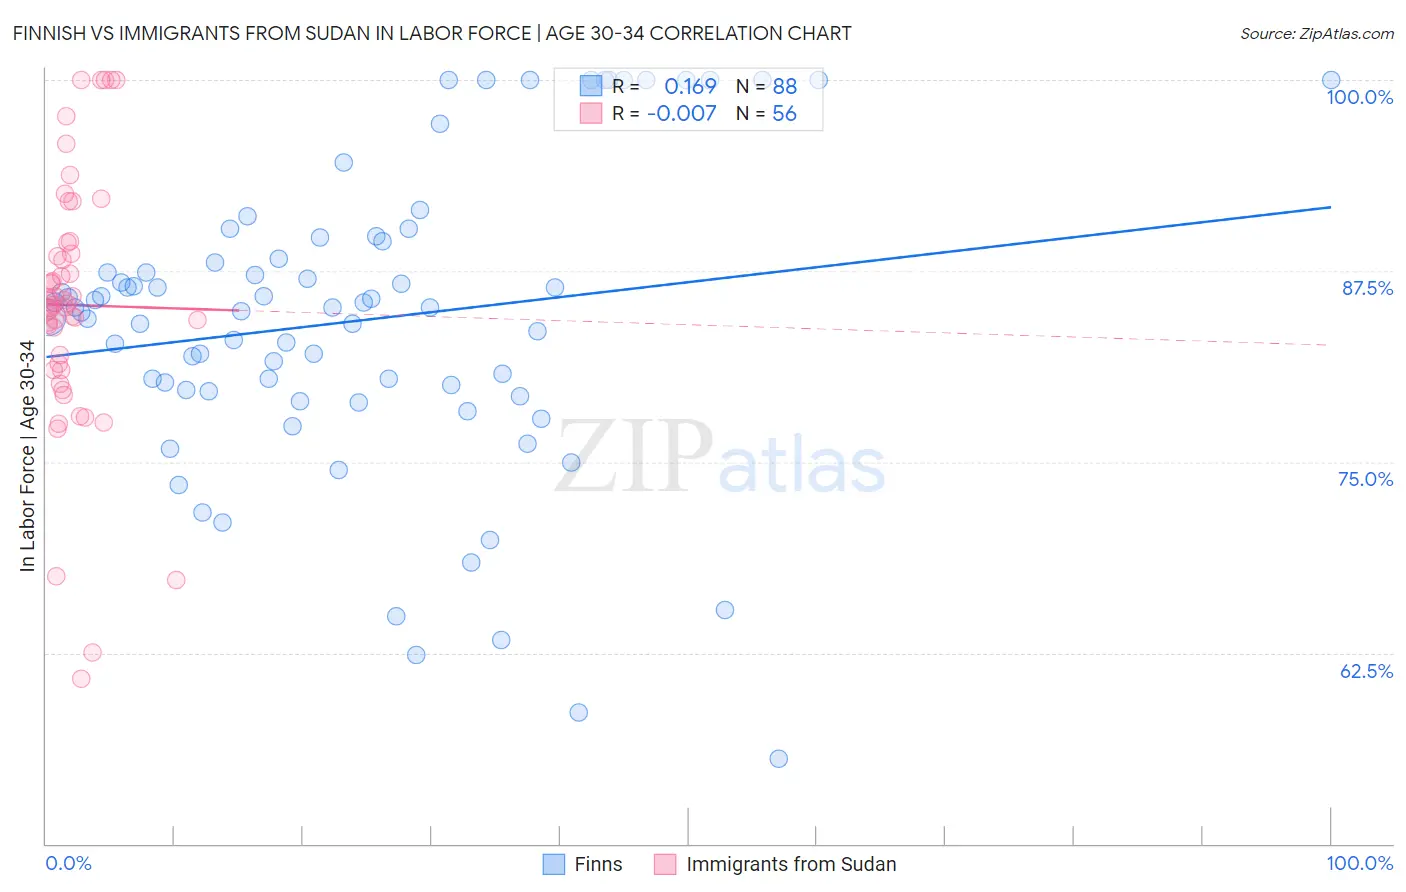
Finnish vs Immigrants from Sudan In Labor Force | Age 30-34 Correlation Chart
The statistical analysis conducted on geographies consisting of 404,404,222 people shows a poor positive correlation between the proportion of Finns and labor force participation rate among population between the ages 30 and 34 in the United States with a correlation coefficient (R) of 0.169 and weighted average of 84.7%. Similarly, the statistical analysis conducted on geographies consisting of 118,954,607 people shows no correlation between the proportion of Immigrants from Sudan and labor force participation rate among population between the ages 30 and 34 in the United States with a correlation coefficient (R) of -0.007 and weighted average of 84.8%, a difference of 0.15%.
In Labor Force | Age 30-34 Correlation Summary
| Measurement | Finnish | Immigrants from Sudan |
| Minimum | 55.6% | 60.8% |
| Maximum | 100.0% | 100.0% |
| Range | 44.4% | 39.2% |
| Mean | 84.2% | 85.3% |
| Median | 85.1% | 85.3% |
| Interquartile 25% (IQ1) | 79.7% | 81.2% |
| Interquartile 75% (IQ3) | 88.9% | 89.0% |
| Interquartile Range (IQR) | 9.2% | 7.8% |
| Standard Deviation (Sample) | 9.9% | 8.4% |
| Standard Deviation (Population) | 9.9% | 8.3% |
Demographics Similar to Finns and Immigrants from Sudan by In Labor Force | Age 30-34
In terms of in labor force | age 30-34, the demographic groups most similar to Finns are Immigrants from Burma/Myanmar (84.7%, a difference of 0.010%), Irish (84.7%, a difference of 0.010%), Immigrants from England (84.7%, a difference of 0.010%), Israeli (84.7%, a difference of 0.010%), and Immigrants from Peru (84.7%, a difference of 0.020%). Similarly, the demographic groups most similar to Immigrants from Sudan are Northern European (84.8%, a difference of 0.0%), French Canadian (84.8%, a difference of 0.020%), Peruvian (84.8%, a difference of 0.030%), Immigrants from Armenia (84.8%, a difference of 0.040%), and Czechoslovakian (84.8%, a difference of 0.050%).
| Demographics | Rating | Rank | In Labor Force | Age 30-34 |
| Northern Europeans | 70.0 /100 | #154 | Good 84.8% |
| Immigrants | Sudan | 69.5 /100 | #155 | Good 84.8% |
| French Canadians | 67.3 /100 | #156 | Good 84.8% |
| Peruvians | 65.9 /100 | #157 | Good 84.8% |
| Immigrants | Armenia | 64.7 /100 | #158 | Good 84.8% |
| Czechoslovakians | 63.0 /100 | #159 | Good 84.8% |
| Pakistanis | 60.8 /100 | #160 | Good 84.7% |
| Immigrants | Cambodia | 60.7 /100 | #161 | Good 84.7% |
| South Americans | 58.7 /100 | #162 | Average 84.7% |
| Immigrants | Uruguay | 57.4 /100 | #163 | Average 84.7% |
| Icelanders | 56.8 /100 | #164 | Average 84.7% |
| Immigrants | Western Europe | 56.7 /100 | #165 | Average 84.7% |
| Afghans | 55.2 /100 | #166 | Average 84.7% |
| Immigrants | South Eastern Asia | 54.2 /100 | #167 | Average 84.7% |
| Immigrants | Peru | 52.4 /100 | #168 | Average 84.7% |
| South American Indians | 52.1 /100 | #169 | Average 84.7% |
| Immigrants | Burma/Myanmar | 52.0 /100 | #170 | Average 84.7% |
| Irish | 52.0 /100 | #171 | Average 84.7% |
| Immigrants | England | 51.7 /100 | #172 | Average 84.7% |
| Israelis | 51.1 /100 | #173 | Average 84.7% |
| Finns | 50.0 /100 | #174 | Average 84.7% |