Finnish vs Puget Sound Salish Receiving Food Stamps
COMPARE
Finnish
Puget Sound Salish
Receiving Food Stamps
Receiving Food Stamps Comparison
Finns
Puget Sound Salish
10.2%
RECEIVING FOOD STAMPS
97.9/ 100
METRIC RATING
90th/ 347
METRIC RANK
13.1%
RECEIVING FOOD STAMPS
3.4/ 100
METRIC RATING
230th/ 347
METRIC RANK
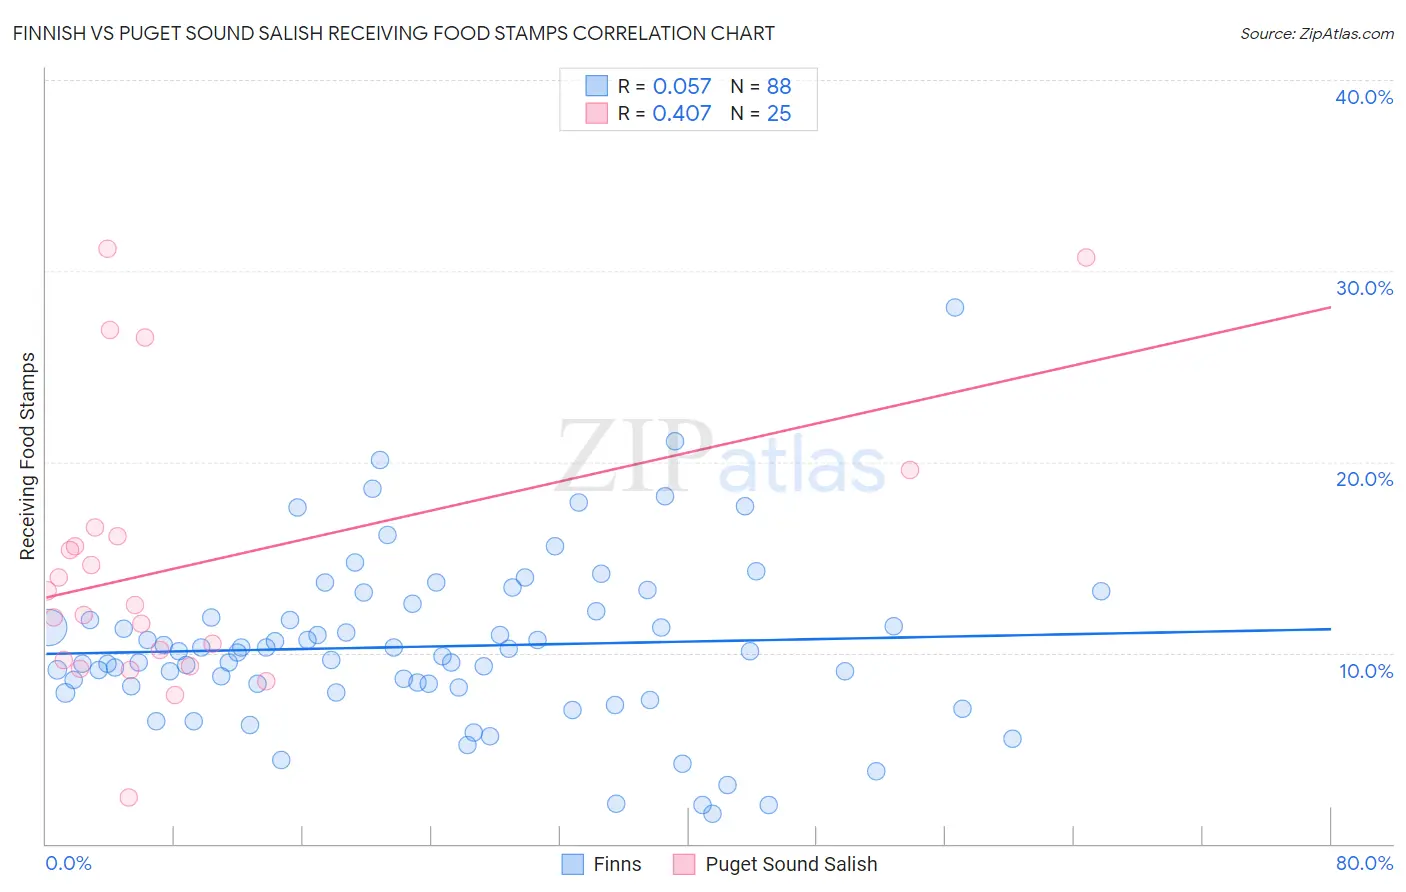
Finnish vs Puget Sound Salish Receiving Food Stamps Correlation Chart
The statistical analysis conducted on geographies consisting of 403,543,220 people shows a slight positive correlation between the proportion of Finns and percentage of population receiving government assistance and/or food stamps in the United States with a correlation coefficient (R) of 0.057 and weighted average of 10.2%. Similarly, the statistical analysis conducted on geographies consisting of 46,113,592 people shows a moderate positive correlation between the proportion of Puget Sound Salish and percentage of population receiving government assistance and/or food stamps in the United States with a correlation coefficient (R) of 0.407 and weighted average of 13.1%, a difference of 29.1%.
Receiving Food Stamps Correlation Summary
| Measurement | Finnish | Puget Sound Salish |
| Minimum | 1.6% | 2.4% |
| Maximum | 28.1% | 31.1% |
| Range | 26.5% | 28.7% |
| Mean | 10.3% | 14.6% |
| Median | 10.0% | 12.5% |
| Interquartile 25% (IQ1) | 8.2% | 9.5% |
| Interquartile 75% (IQ3) | 12.0% | 16.3% |
| Interquartile Range (IQR) | 3.8% | 6.9% |
| Standard Deviation (Sample) | 4.4% | 7.3% |
| Standard Deviation (Population) | 4.4% | 7.1% |
Similar Demographics by Receiving Food Stamps
Demographics Similar to Finns by Receiving Food Stamps
In terms of receiving food stamps, the demographic groups most similar to Finns are Jordanian (10.2%, a difference of 0.040%), Irish (10.2%, a difference of 0.040%), Belgian (10.2%, a difference of 0.42%), Immigrants from France (10.1%, a difference of 0.85%), and Immigrants from Greece (10.3%, a difference of 0.95%).
| Demographics | Rating | Rank | Receiving Food Stamps |
| Dutch | 98.6 /100 | #83 | Exceptional 10.0% |
| Immigrants | Israel | 98.5 /100 | #84 | Exceptional 10.0% |
| Immigrants | Romania | 98.5 /100 | #85 | Exceptional 10.0% |
| Immigrants | Norway | 98.4 /100 | #86 | Exceptional 10.0% |
| Egyptians | 98.4 /100 | #87 | Exceptional 10.0% |
| Immigrants | Kuwait | 98.4 /100 | #88 | Exceptional 10.0% |
| Immigrants | France | 98.3 /100 | #89 | Exceptional 10.1% |
| Finns | 97.9 /100 | #90 | Exceptional 10.2% |
| Jordanians | 97.9 /100 | #91 | Exceptional 10.2% |
| Irish | 97.9 /100 | #92 | Exceptional 10.2% |
| Belgians | 97.7 /100 | #93 | Exceptional 10.2% |
| Immigrants | Greece | 97.4 /100 | #94 | Exceptional 10.3% |
| Basques | 97.4 /100 | #95 | Exceptional 10.3% |
| Welsh | 97.3 /100 | #96 | Exceptional 10.3% |
| Czechoslovakians | 97.2 /100 | #97 | Exceptional 10.3% |
Demographics Similar to Puget Sound Salish by Receiving Food Stamps
In terms of receiving food stamps, the demographic groups most similar to Puget Sound Salish are Immigrants from Nigeria (13.1%, a difference of 0.040%), Ottawa (13.1%, a difference of 0.050%), Panamanian (13.1%, a difference of 0.060%), Nigerian (13.1%, a difference of 0.070%), and Chickasaw (13.1%, a difference of 0.12%).
| Demographics | Rating | Rank | Receiving Food Stamps |
| Immigrants | Albania | 4.4 /100 | #223 | Tragic 13.0% |
| Immigrants | Armenia | 4.3 /100 | #224 | Tragic 13.0% |
| Fijians | 4.3 /100 | #225 | Tragic 13.0% |
| Chickasaw | 3.6 /100 | #226 | Tragic 13.1% |
| Nigerians | 3.5 /100 | #227 | Tragic 13.1% |
| Panamanians | 3.5 /100 | #228 | Tragic 13.1% |
| Ottawa | 3.5 /100 | #229 | Tragic 13.1% |
| Puget Sound Salish | 3.4 /100 | #230 | Tragic 13.1% |
| Immigrants | Nigeria | 3.4 /100 | #231 | Tragic 13.1% |
| Salvadorans | 2.7 /100 | #232 | Tragic 13.2% |
| Cherokee | 2.5 /100 | #233 | Tragic 13.2% |
| Comanche | 2.4 /100 | #234 | Tragic 13.3% |
| Immigrants | Zaire | 1.9 /100 | #235 | Tragic 13.4% |
| Crow | 1.6 /100 | #236 | Tragic 13.4% |
| Immigrants | El Salvador | 1.5 /100 | #237 | Tragic 13.5% |