Finnish vs Immigrants from Sudan Median Family Income
COMPARE
Finnish
Immigrants from Sudan
Median Family Income
Median Family Income Comparison
Finns
Immigrants from Sudan
$102,676
MEDIAN FAMILY INCOME
50.0/ 100
METRIC RATING
174th/ 347
METRIC RANK
$97,737
MEDIAN FAMILY INCOME
7.4/ 100
METRIC RATING
211th/ 347
METRIC RANK
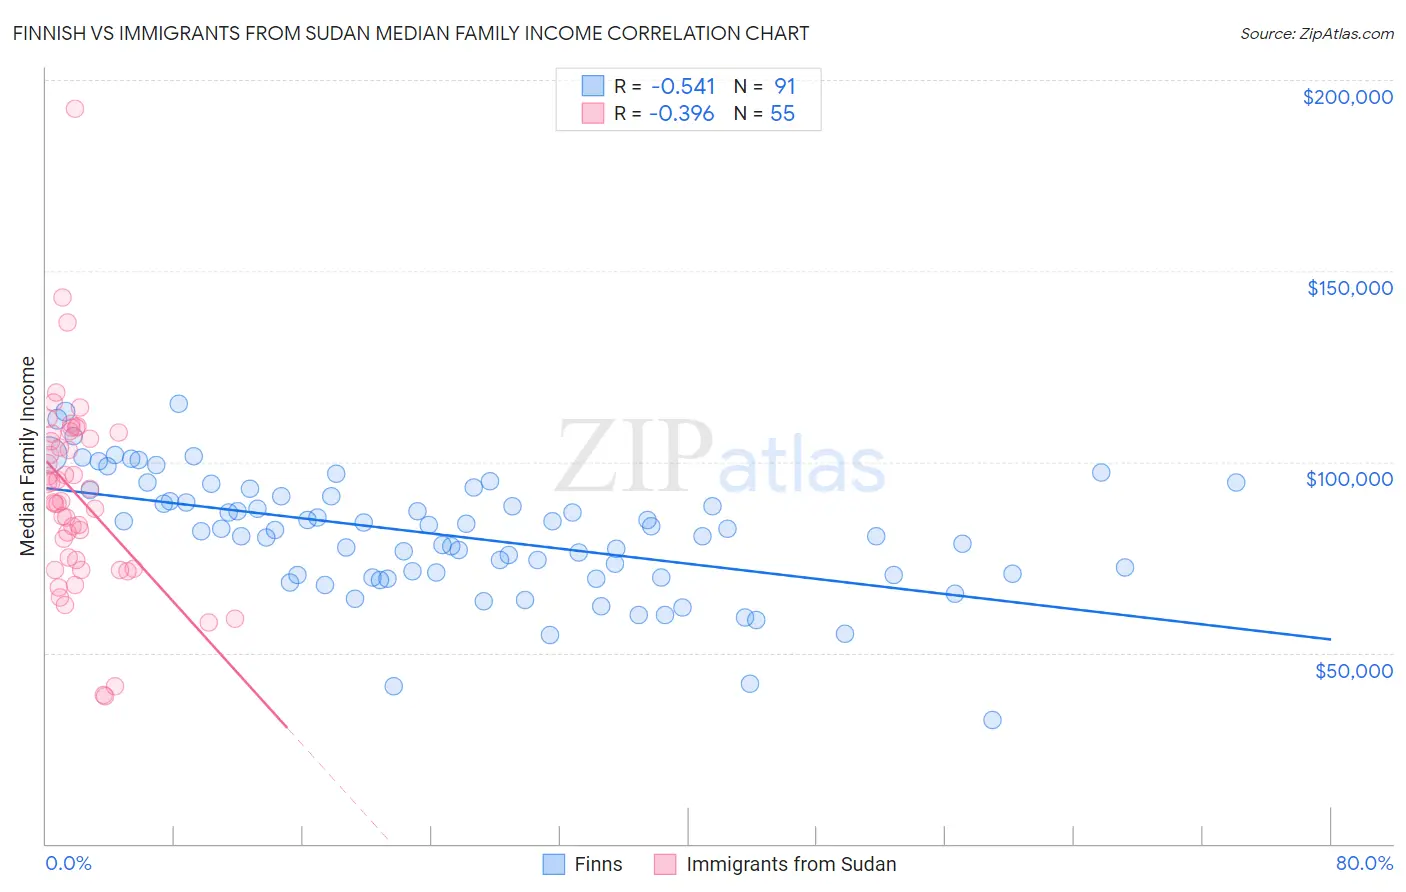
Finnish vs Immigrants from Sudan Median Family Income Correlation Chart
The statistical analysis conducted on geographies consisting of 404,403,352 people shows a substantial negative correlation between the proportion of Finns and median family income in the United States with a correlation coefficient (R) of -0.541 and weighted average of $102,676. Similarly, the statistical analysis conducted on geographies consisting of 118,933,940 people shows a mild negative correlation between the proportion of Immigrants from Sudan and median family income in the United States with a correlation coefficient (R) of -0.396 and weighted average of $97,737, a difference of 5.1%.
Median Family Income Correlation Summary
| Measurement | Finnish | Immigrants from Sudan |
| Minimum | $32,321 | $38,705 |
| Maximum | $115,182 | $192,500 |
| Range | $82,861 | $153,795 |
| Mean | $80,730 | $91,079 |
| Median | $82,170 | $89,618 |
| Interquartile 25% (IQ1) | $70,230 | $71,964 |
| Interquartile 75% (IQ3) | $91,138 | $107,289 |
| Interquartile Range (IQR) | $20,909 | $35,325 |
| Standard Deviation (Sample) | $15,710 | $25,898 |
| Standard Deviation (Population) | $15,623 | $25,661 |
Similar Demographics by Median Family Income
Demographics Similar to Finns by Median Family Income
In terms of median family income, the demographic groups most similar to Finns are Belgian ($102,788, a difference of 0.11%), Immigrants from Eritrea ($102,823, a difference of 0.14%), Immigrants from Eastern Africa ($102,451, a difference of 0.22%), French ($102,368, a difference of 0.30%), and Alsatian ($103,010, a difference of 0.33%).
| Demographics | Rating | Rank | Median Family Income |
| South American Indians | 61.9 /100 | #167 | Good $103,624 |
| Immigrants | Peru | 60.8 /100 | #168 | Good $103,534 |
| Czechoslovakians | 57.6 /100 | #169 | Average $103,273 |
| Immigrants | Uzbekistan | 56.6 /100 | #170 | Average $103,197 |
| Alsatians | 54.3 /100 | #171 | Average $103,010 |
| Immigrants | Eritrea | 51.9 /100 | #172 | Average $102,823 |
| Belgians | 51.4 /100 | #173 | Average $102,788 |
| Finns | 50.0 /100 | #174 | Average $102,676 |
| Immigrants | Eastern Africa | 47.1 /100 | #175 | Average $102,451 |
| French | 46.1 /100 | #176 | Average $102,368 |
| Germans | 44.6 /100 | #177 | Average $102,254 |
| Welsh | 43.3 /100 | #178 | Average $102,151 |
| South Americans | 39.7 /100 | #179 | Fair $101,856 |
| French Canadians | 37.0 /100 | #180 | Fair $101,634 |
| Spaniards | 36.8 /100 | #181 | Fair $101,617 |
Demographics Similar to Immigrants from Sudan by Median Family Income
In terms of median family income, the demographic groups most similar to Immigrants from Sudan are Panamanian ($97,683, a difference of 0.050%), Immigrants from Armenia ($97,605, a difference of 0.13%), Bermudan ($97,577, a difference of 0.16%), Nigerian ($97,522, a difference of 0.22%), and Puget Sound Salish ($97,958, a difference of 0.23%).
| Demographics | Rating | Rank | Median Family Income |
| Ghanaians | 12.6 /100 | #204 | Poor $98,877 |
| Hawaiians | 12.5 /100 | #205 | Poor $98,869 |
| Immigrants | Iraq | 12.1 /100 | #206 | Poor $98,786 |
| Aleuts | 11.6 /100 | #207 | Poor $98,702 |
| Immigrants | Uruguay | 9.2 /100 | #208 | Tragic $98,205 |
| Immigrants | Colombia | 8.7 /100 | #209 | Tragic $98,067 |
| Puget Sound Salish | 8.2 /100 | #210 | Tragic $97,958 |
| Immigrants | Sudan | 7.4 /100 | #211 | Tragic $97,737 |
| Panamanians | 7.2 /100 | #212 | Tragic $97,683 |
| Immigrants | Armenia | 7.0 /100 | #213 | Tragic $97,605 |
| Bermudans | 6.9 /100 | #214 | Tragic $97,577 |
| Nigerians | 6.7 /100 | #215 | Tragic $97,522 |
| Immigrants | Bosnia and Herzegovina | 6.4 /100 | #216 | Tragic $97,432 |
| Japanese | 6.0 /100 | #217 | Tragic $97,288 |
| Immigrants | Cambodia | 5.8 /100 | #218 | Tragic $97,222 |