Comanche vs Immigrants from Sudan Receiving Food Stamps
COMPARE
Comanche
Immigrants from Sudan
Receiving Food Stamps
Receiving Food Stamps Comparison
Comanche
Immigrants from Sudan
13.3%
RECEIVING FOOD STAMPS
2.4/ 100
METRIC RATING
234th/ 347
METRIC RANK
12.1%
RECEIVING FOOD STAMPS
27.1/ 100
METRIC RATING
194th/ 347
METRIC RANK
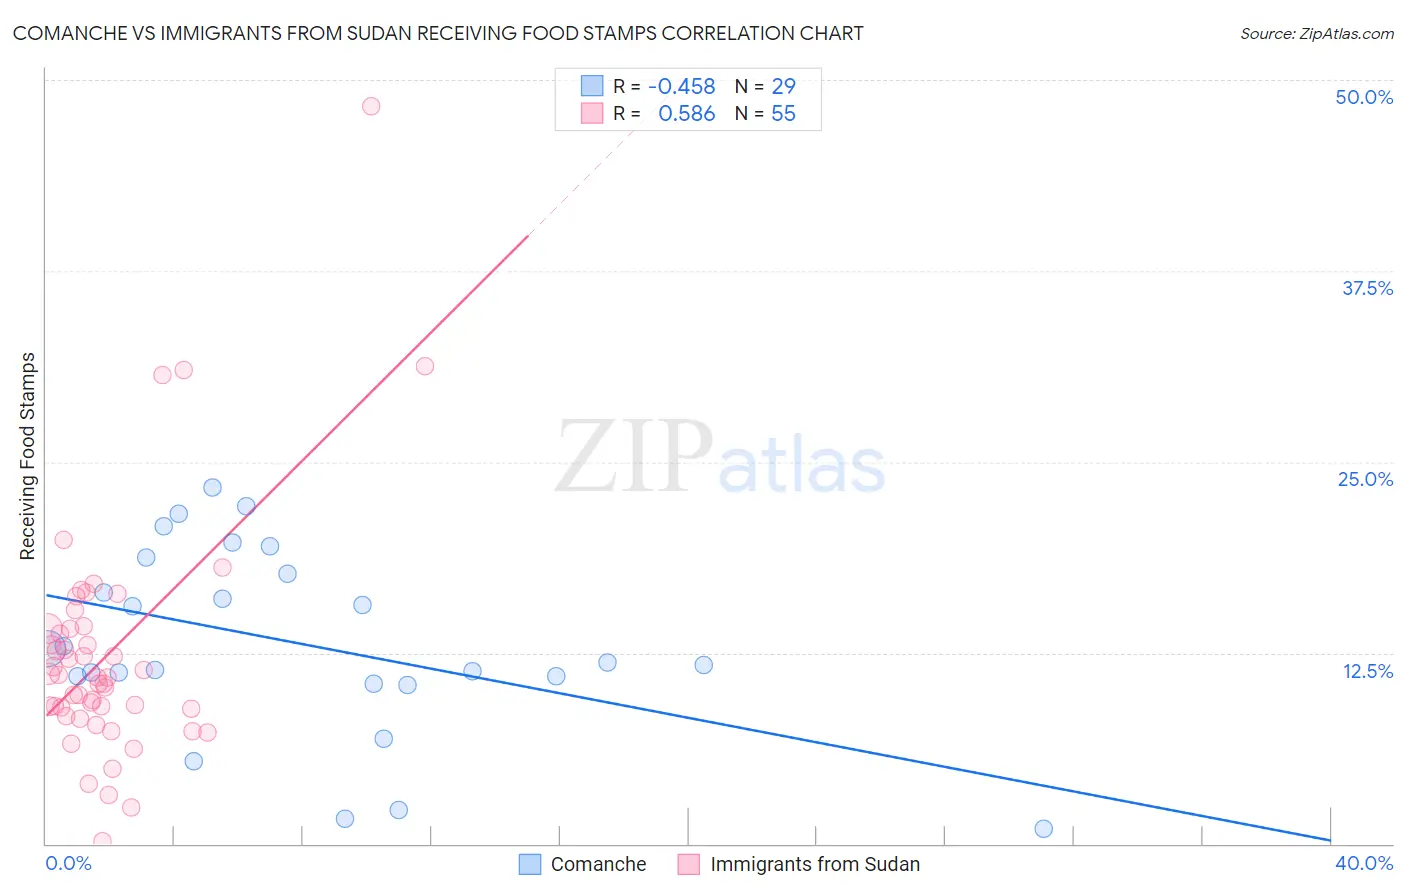
Comanche vs Immigrants from Sudan Receiving Food Stamps Correlation Chart
The statistical analysis conducted on geographies consisting of 109,741,835 people shows a moderate negative correlation between the proportion of Comanche and percentage of population receiving government assistance and/or food stamps in the United States with a correlation coefficient (R) of -0.458 and weighted average of 13.3%. Similarly, the statistical analysis conducted on geographies consisting of 118,933,467 people shows a substantial positive correlation between the proportion of Immigrants from Sudan and percentage of population receiving government assistance and/or food stamps in the United States with a correlation coefficient (R) of 0.586 and weighted average of 12.1%, a difference of 9.2%.
Receiving Food Stamps Correlation Summary
| Measurement | Comanche | Immigrants from Sudan |
| Minimum | 1.0% | 0.20% |
| Maximum | 23.3% | 48.3% |
| Range | 22.3% | 48.1% |
| Mean | 13.1% | 12.5% |
| Median | 11.9% | 10.9% |
| Interquartile 25% (IQ1) | 10.7% | 8.8% |
| Interquartile 75% (IQ3) | 18.2% | 14.1% |
| Interquartile Range (IQR) | 7.5% | 5.3% |
| Standard Deviation (Sample) | 6.0% | 7.8% |
| Standard Deviation (Population) | 5.9% | 7.8% |
Similar Demographics by Receiving Food Stamps
Demographics Similar to Comanche by Receiving Food Stamps
In terms of receiving food stamps, the demographic groups most similar to Comanche are Cherokee (13.2%, a difference of 0.13%), Salvadoran (13.2%, a difference of 0.38%), Immigrants from Zaire (13.4%, a difference of 0.77%), Immigrants from Nigeria (13.1%, a difference of 1.1%), and Puget Sound Salish (13.1%, a difference of 1.1%).
| Demographics | Rating | Rank | Receiving Food Stamps |
| Nigerians | 3.5 /100 | #227 | Tragic 13.1% |
| Panamanians | 3.5 /100 | #228 | Tragic 13.1% |
| Ottawa | 3.5 /100 | #229 | Tragic 13.1% |
| Puget Sound Salish | 3.4 /100 | #230 | Tragic 13.1% |
| Immigrants | Nigeria | 3.4 /100 | #231 | Tragic 13.1% |
| Salvadorans | 2.7 /100 | #232 | Tragic 13.2% |
| Cherokee | 2.5 /100 | #233 | Tragic 13.2% |
| Comanche | 2.4 /100 | #234 | Tragic 13.3% |
| Immigrants | Zaire | 1.9 /100 | #235 | Tragic 13.4% |
| Crow | 1.6 /100 | #236 | Tragic 13.4% |
| Immigrants | El Salvador | 1.5 /100 | #237 | Tragic 13.5% |
| French American Indians | 1.4 /100 | #238 | Tragic 13.5% |
| Immigrants | Micronesia | 1.3 /100 | #239 | Tragic 13.5% |
| Iroquois | 1.2 /100 | #240 | Tragic 13.5% |
| Choctaw | 1.0 /100 | #241 | Tragic 13.6% |
Demographics Similar to Immigrants from Sudan by Receiving Food Stamps
In terms of receiving food stamps, the demographic groups most similar to Immigrants from Sudan are American (12.2%, a difference of 0.060%), Iraqi (12.2%, a difference of 0.090%), Immigrants from Fiji (12.1%, a difference of 0.12%), Delaware (12.2%, a difference of 0.17%), and Immigrants from Costa Rica (12.2%, a difference of 0.30%).
| Demographics | Rating | Rank | Receiving Food Stamps |
| Albanians | 35.4 /100 | #187 | Fair 12.0% |
| Sudanese | 33.4 /100 | #188 | Fair 12.0% |
| Immigrants | Cameroon | 32.5 /100 | #189 | Fair 12.0% |
| Immigrants | Peru | 32.2 /100 | #190 | Fair 12.0% |
| Venezuelans | 32.1 /100 | #191 | Fair 12.0% |
| Samoans | 31.0 /100 | #192 | Fair 12.1% |
| Immigrants | Fiji | 27.8 /100 | #193 | Fair 12.1% |
| Immigrants | Sudan | 27.1 /100 | #194 | Fair 12.1% |
| Americans | 26.7 /100 | #195 | Fair 12.2% |
| Iraqis | 26.6 /100 | #196 | Fair 12.2% |
| Delaware | 26.1 /100 | #197 | Fair 12.2% |
| Immigrants | Costa Rica | 25.4 /100 | #198 | Fair 12.2% |
| Portuguese | 25.1 /100 | #199 | Fair 12.2% |
| Sierra Leoneans | 23.6 /100 | #200 | Fair 12.2% |
| Ugandans | 22.5 /100 | #201 | Fair 12.2% |