Finnish vs Immigrants from Sudan Female Disability
COMPARE
Finnish
Immigrants from Sudan
Female Disability
Female Disability Comparison
Finns
Immigrants from Sudan
12.8%
FEMALE DISABILITY
0.4/ 100
METRIC RATING
266th/ 347
METRIC RANK
11.9%
FEMALE DISABILITY
89.6/ 100
METRIC RATING
143rd/ 347
METRIC RANK
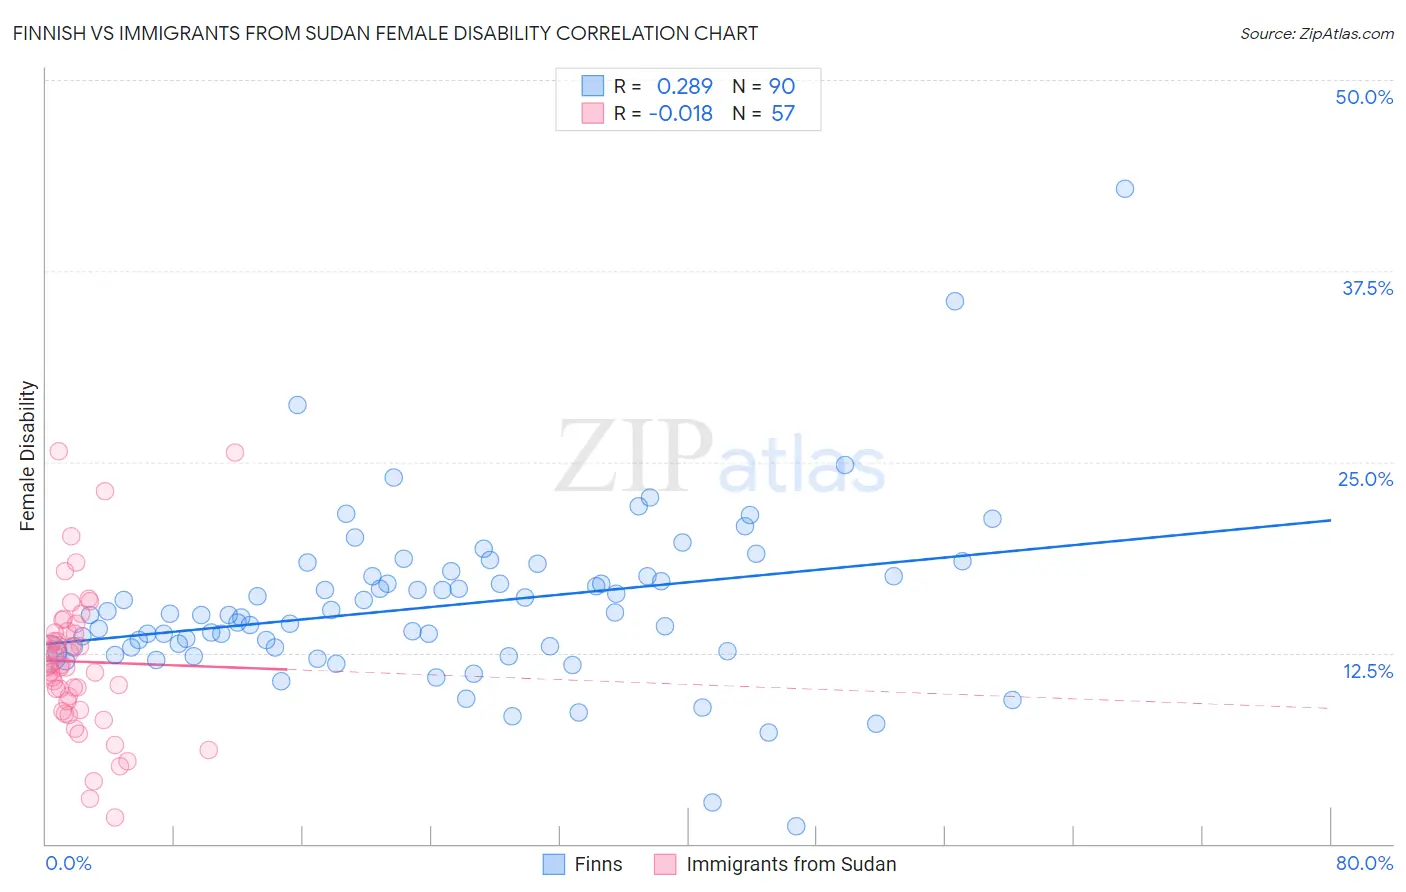
Finnish vs Immigrants from Sudan Female Disability Correlation Chart
The statistical analysis conducted on geographies consisting of 404,612,195 people shows a weak positive correlation between the proportion of Finns and percentage of females with a disability in the United States with a correlation coefficient (R) of 0.289 and weighted average of 12.8%. Similarly, the statistical analysis conducted on geographies consisting of 118,956,198 people shows no correlation between the proportion of Immigrants from Sudan and percentage of females with a disability in the United States with a correlation coefficient (R) of -0.018 and weighted average of 11.9%, a difference of 7.3%.
Female Disability Correlation Summary
| Measurement | Finnish | Immigrants from Sudan |
| Minimum | 1.2% | 1.7% |
| Maximum | 42.9% | 25.7% |
| Range | 41.7% | 24.0% |
| Mean | 15.5% | 11.9% |
| Median | 15.0% | 11.6% |
| Interquartile 25% (IQ1) | 12.6% | 9.0% |
| Interquartile 75% (IQ3) | 17.5% | 13.9% |
| Interquartile Range (IQR) | 5.0% | 4.9% |
| Standard Deviation (Sample) | 5.6% | 4.8% |
| Standard Deviation (Population) | 5.6% | 4.7% |
Similar Demographics by Female Disability
Demographics Similar to Finns by Female Disability
In terms of female disability, the demographic groups most similar to Finns are Senegalese (12.8%, a difference of 0.020%), Immigrants from Laos (12.8%, a difference of 0.040%), Indonesian (12.8%, a difference of 0.10%), West Indian (12.8%, a difference of 0.12%), and Immigrants from Liberia (12.9%, a difference of 0.28%).
| Demographics | Rating | Rank | Female Disability |
| Immigrants | Armenia | 1.0 /100 | #259 | Tragic 12.7% |
| Sub-Saharan Africans | 1.0 /100 | #260 | Tragic 12.7% |
| Bermudans | 1.0 /100 | #261 | Tragic 12.7% |
| Czechoslovakians | 0.9 /100 | #262 | Tragic 12.7% |
| Spaniards | 0.7 /100 | #263 | Tragic 12.8% |
| Alaska Natives | 0.6 /100 | #264 | Tragic 12.8% |
| West Indians | 0.5 /100 | #265 | Tragic 12.8% |
| Finns | 0.4 /100 | #266 | Tragic 12.8% |
| Senegalese | 0.4 /100 | #267 | Tragic 12.8% |
| Immigrants | Laos | 0.4 /100 | #268 | Tragic 12.8% |
| Indonesians | 0.4 /100 | #269 | Tragic 12.8% |
| Immigrants | Liberia | 0.3 /100 | #270 | Tragic 12.9% |
| Dutch | 0.2 /100 | #271 | Tragic 12.9% |
| Germans | 0.1 /100 | #272 | Tragic 12.9% |
| Sioux | 0.1 /100 | #273 | Tragic 12.9% |
Demographics Similar to Immigrants from Sudan by Female Disability
In terms of female disability, the demographic groups most similar to Immigrants from Sudan are Immigrants from Africa (11.9%, a difference of 0.040%), Immigrants from Austria (12.0%, a difference of 0.17%), Estonian (12.0%, a difference of 0.17%), Immigrants from Ecuador (11.9%, a difference of 0.21%), and Romanian (11.9%, a difference of 0.23%).
| Demographics | Rating | Rank | Female Disability |
| Ugandans | 94.0 /100 | #136 | Exceptional 11.9% |
| Immigrants | Norway | 93.8 /100 | #137 | Exceptional 11.9% |
| Ecuadorians | 93.4 /100 | #138 | Exceptional 11.9% |
| Immigrants | Hungary | 92.8 /100 | #139 | Exceptional 11.9% |
| Romanians | 91.6 /100 | #140 | Exceptional 11.9% |
| Immigrants | Ecuador | 91.5 /100 | #141 | Exceptional 11.9% |
| Immigrants | Africa | 90.0 /100 | #142 | Excellent 11.9% |
| Immigrants | Sudan | 89.6 /100 | #143 | Excellent 11.9% |
| Immigrants | Austria | 87.9 /100 | #144 | Excellent 12.0% |
| Estonians | 87.8 /100 | #145 | Excellent 12.0% |
| Pakistanis | 84.6 /100 | #146 | Excellent 12.0% |
| Nigerians | 84.0 /100 | #147 | Excellent 12.0% |
| Immigrants | Kenya | 83.1 /100 | #148 | Excellent 12.0% |
| Greeks | 82.0 /100 | #149 | Excellent 12.0% |
| Immigrants | Moldova | 81.4 /100 | #150 | Excellent 12.0% |