Finnish vs Yugoslavian Receiving Food Stamps
COMPARE
Finnish
Yugoslavian
Receiving Food Stamps
Receiving Food Stamps Comparison
Finns
Yugoslavians
10.2%
RECEIVING FOOD STAMPS
97.9/ 100
METRIC RATING
90th/ 347
METRIC RANK
10.7%
RECEIVING FOOD STAMPS
92.5/ 100
METRIC RATING
129th/ 347
METRIC RANK
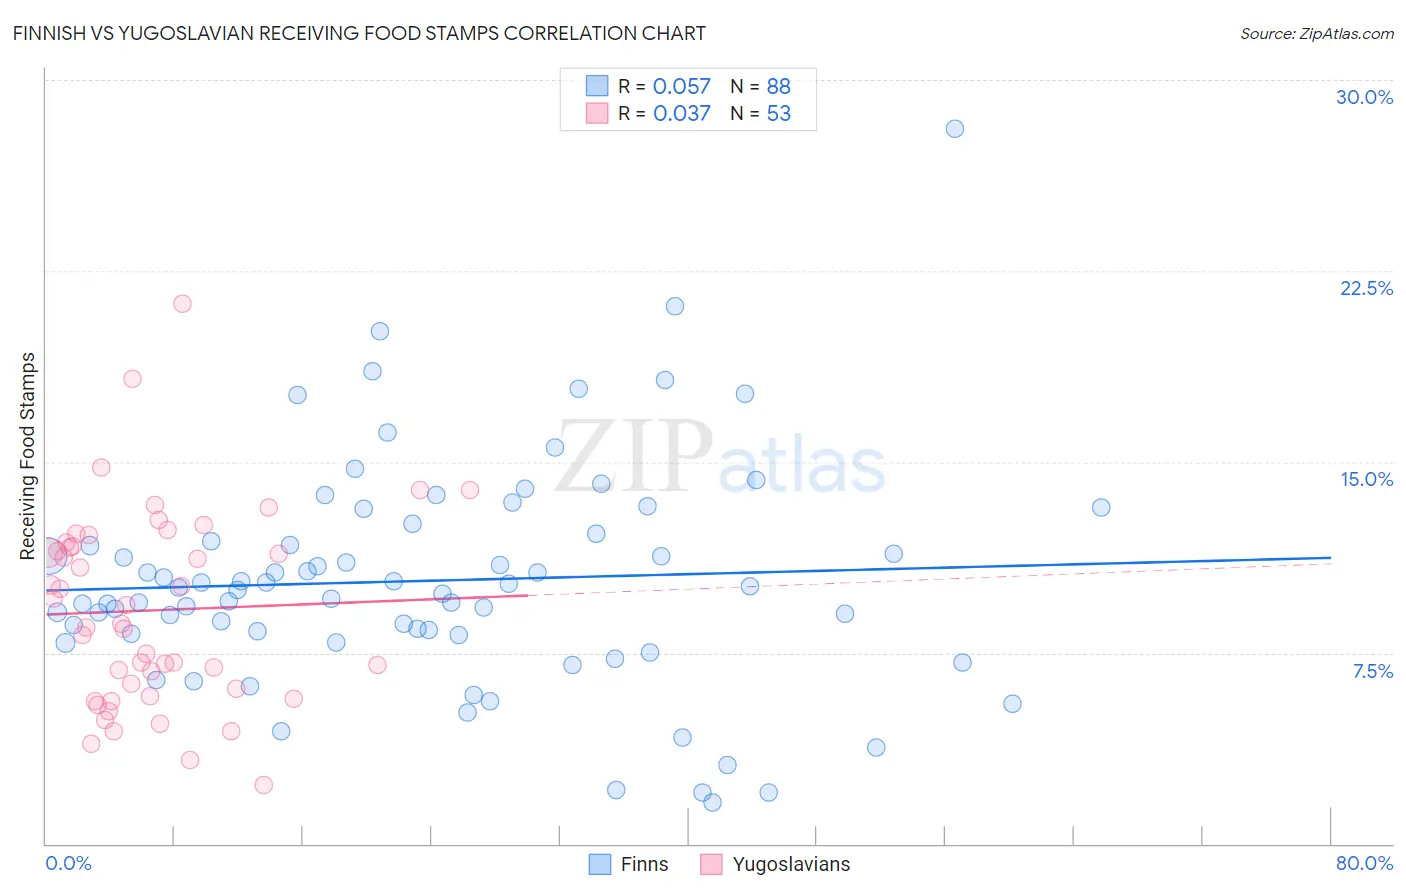
Finnish vs Yugoslavian Receiving Food Stamps Correlation Chart
The statistical analysis conducted on geographies consisting of 403,543,220 people shows a slight positive correlation between the proportion of Finns and percentage of population receiving government assistance and/or food stamps in the United States with a correlation coefficient (R) of 0.057 and weighted average of 10.2%. Similarly, the statistical analysis conducted on geographies consisting of 285,227,567 people shows no correlation between the proportion of Yugoslavians and percentage of population receiving government assistance and/or food stamps in the United States with a correlation coefficient (R) of 0.037 and weighted average of 10.7%, a difference of 5.4%.
Receiving Food Stamps Correlation Summary
| Measurement | Finnish | Yugoslavian |
| Minimum | 1.6% | 2.3% |
| Maximum | 28.1% | 21.2% |
| Range | 26.5% | 18.9% |
| Mean | 10.3% | 9.2% |
| Median | 10.0% | 8.6% |
| Interquartile 25% (IQ1) | 8.2% | 5.9% |
| Interquartile 75% (IQ3) | 12.0% | 11.7% |
| Interquartile Range (IQR) | 3.8% | 5.8% |
| Standard Deviation (Sample) | 4.4% | 3.8% |
| Standard Deviation (Population) | 4.4% | 3.8% |
Similar Demographics by Receiving Food Stamps
Demographics Similar to Finns by Receiving Food Stamps
In terms of receiving food stamps, the demographic groups most similar to Finns are Jordanian (10.2%, a difference of 0.040%), Irish (10.2%, a difference of 0.040%), Belgian (10.2%, a difference of 0.42%), Immigrants from France (10.1%, a difference of 0.85%), and Immigrants from Greece (10.3%, a difference of 0.95%).
| Demographics | Rating | Rank | Receiving Food Stamps |
| Dutch | 98.6 /100 | #83 | Exceptional 10.0% |
| Immigrants | Israel | 98.5 /100 | #84 | Exceptional 10.0% |
| Immigrants | Romania | 98.5 /100 | #85 | Exceptional 10.0% |
| Immigrants | Norway | 98.4 /100 | #86 | Exceptional 10.0% |
| Egyptians | 98.4 /100 | #87 | Exceptional 10.0% |
| Immigrants | Kuwait | 98.4 /100 | #88 | Exceptional 10.0% |
| Immigrants | France | 98.3 /100 | #89 | Exceptional 10.1% |
| Finns | 97.9 /100 | #90 | Exceptional 10.2% |
| Jordanians | 97.9 /100 | #91 | Exceptional 10.2% |
| Irish | 97.9 /100 | #92 | Exceptional 10.2% |
| Belgians | 97.7 /100 | #93 | Exceptional 10.2% |
| Immigrants | Greece | 97.4 /100 | #94 | Exceptional 10.3% |
| Basques | 97.4 /100 | #95 | Exceptional 10.3% |
| Welsh | 97.3 /100 | #96 | Exceptional 10.3% |
| Czechoslovakians | 97.2 /100 | #97 | Exceptional 10.3% |
Demographics Similar to Yugoslavians by Receiving Food Stamps
In terms of receiving food stamps, the demographic groups most similar to Yugoslavians are Immigrants from Jordan (10.7%, a difference of 0.0%), Immigrants from Ethiopia (10.7%, a difference of 0.010%), Afghan (10.7%, a difference of 0.030%), Israeli (10.7%, a difference of 0.10%), and French (10.7%, a difference of 0.10%).
| Demographics | Rating | Rank | Receiving Food Stamps |
| Sri Lankans | 93.7 /100 | #122 | Exceptional 10.6% |
| Immigrants | Philippines | 93.3 /100 | #123 | Exceptional 10.7% |
| Paraguayans | 93.0 /100 | #124 | Exceptional 10.7% |
| Ukrainians | 92.8 /100 | #125 | Exceptional 10.7% |
| Afghans | 92.6 /100 | #126 | Exceptional 10.7% |
| Immigrants | Ethiopia | 92.6 /100 | #127 | Exceptional 10.7% |
| Immigrants | Jordan | 92.5 /100 | #128 | Exceptional 10.7% |
| Yugoslavians | 92.5 /100 | #129 | Exceptional 10.7% |
| Israelis | 92.4 /100 | #130 | Exceptional 10.7% |
| French | 92.3 /100 | #131 | Exceptional 10.7% |
| Immigrants | Germany | 92.0 /100 | #132 | Exceptional 10.7% |
| Immigrants | Russia | 90.9 /100 | #133 | Exceptional 10.8% |
| Immigrants | Brazil | 90.3 /100 | #134 | Exceptional 10.8% |
| Argentineans | 90.2 /100 | #135 | Exceptional 10.8% |
| Slovaks | 89.8 /100 | #136 | Excellent 10.8% |