Finnish vs Immigrants from Senegal Receiving Food Stamps
COMPARE
Finnish
Immigrants from Senegal
Receiving Food Stamps
Receiving Food Stamps Comparison
Finns
Immigrants from Senegal
10.2%
RECEIVING FOOD STAMPS
97.9/ 100
METRIC RATING
90th/ 347
METRIC RANK
15.3%
RECEIVING FOOD STAMPS
0.0/ 100
METRIC RATING
289th/ 347
METRIC RANK
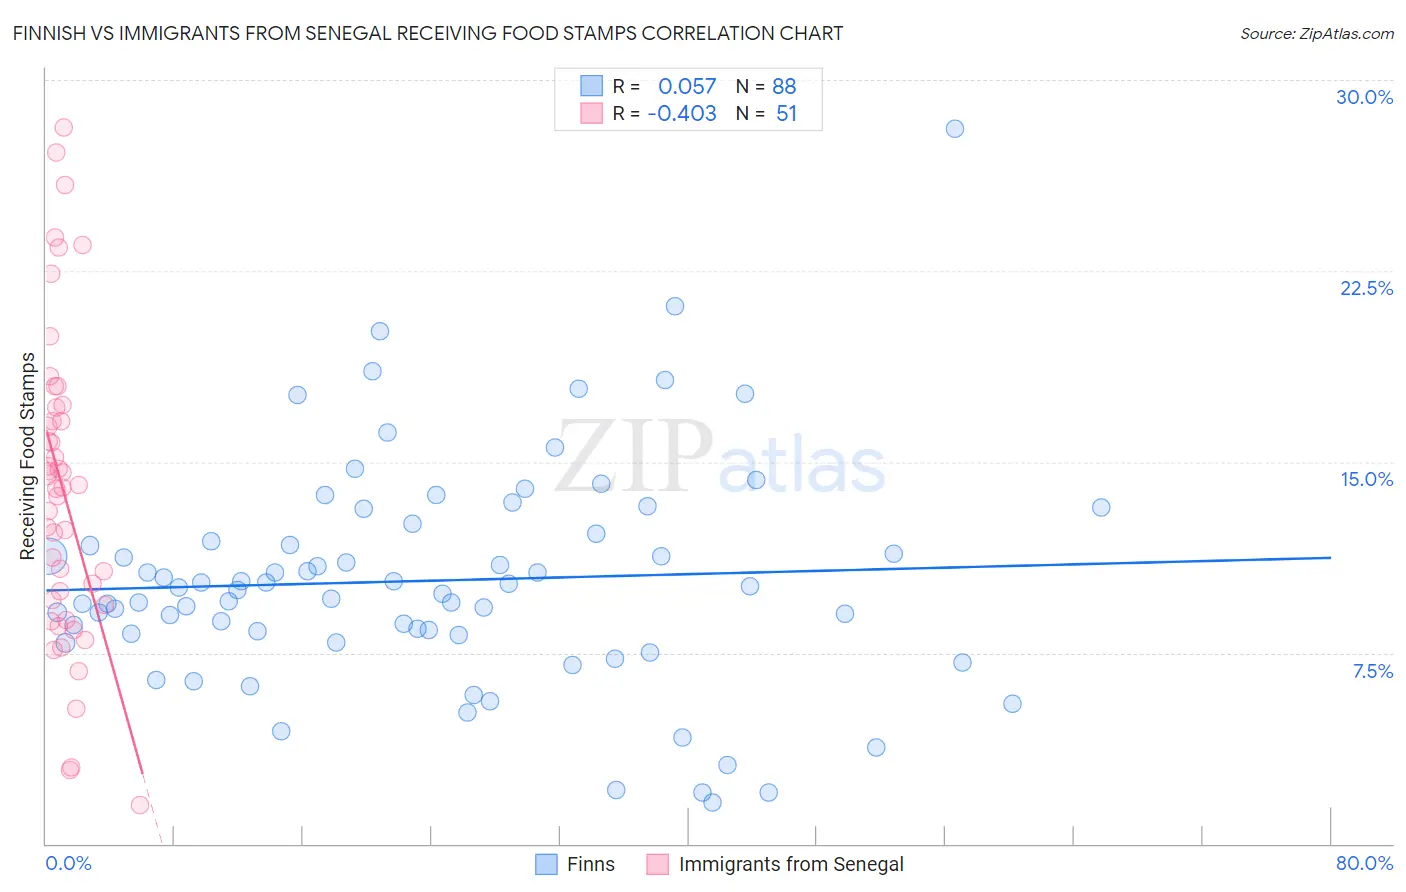
Finnish vs Immigrants from Senegal Receiving Food Stamps Correlation Chart
The statistical analysis conducted on geographies consisting of 403,543,220 people shows a slight positive correlation between the proportion of Finns and percentage of population receiving government assistance and/or food stamps in the United States with a correlation coefficient (R) of 0.057 and weighted average of 10.2%. Similarly, the statistical analysis conducted on geographies consisting of 90,108,306 people shows a moderate negative correlation between the proportion of Immigrants from Senegal and percentage of population receiving government assistance and/or food stamps in the United States with a correlation coefficient (R) of -0.403 and weighted average of 15.3%, a difference of 51.1%.
Receiving Food Stamps Correlation Summary
| Measurement | Finnish | Immigrants from Senegal |
| Minimum | 1.6% | 1.5% |
| Maximum | 28.1% | 28.1% |
| Range | 26.5% | 26.6% |
| Mean | 10.3% | 13.9% |
| Median | 10.0% | 14.0% |
| Interquartile 25% (IQ1) | 8.2% | 9.4% |
| Interquartile 75% (IQ3) | 12.0% | 17.1% |
| Interquartile Range (IQR) | 3.8% | 7.7% |
| Standard Deviation (Sample) | 4.4% | 6.1% |
| Standard Deviation (Population) | 4.4% | 6.0% |
Similar Demographics by Receiving Food Stamps
Demographics Similar to Finns by Receiving Food Stamps
In terms of receiving food stamps, the demographic groups most similar to Finns are Jordanian (10.2%, a difference of 0.040%), Irish (10.2%, a difference of 0.040%), Belgian (10.2%, a difference of 0.42%), Immigrants from France (10.1%, a difference of 0.85%), and Immigrants from Greece (10.3%, a difference of 0.95%).
| Demographics | Rating | Rank | Receiving Food Stamps |
| Dutch | 98.6 /100 | #83 | Exceptional 10.0% |
| Immigrants | Israel | 98.5 /100 | #84 | Exceptional 10.0% |
| Immigrants | Romania | 98.5 /100 | #85 | Exceptional 10.0% |
| Immigrants | Norway | 98.4 /100 | #86 | Exceptional 10.0% |
| Egyptians | 98.4 /100 | #87 | Exceptional 10.0% |
| Immigrants | Kuwait | 98.4 /100 | #88 | Exceptional 10.0% |
| Immigrants | France | 98.3 /100 | #89 | Exceptional 10.1% |
| Finns | 97.9 /100 | #90 | Exceptional 10.2% |
| Jordanians | 97.9 /100 | #91 | Exceptional 10.2% |
| Irish | 97.9 /100 | #92 | Exceptional 10.2% |
| Belgians | 97.7 /100 | #93 | Exceptional 10.2% |
| Immigrants | Greece | 97.4 /100 | #94 | Exceptional 10.3% |
| Basques | 97.4 /100 | #95 | Exceptional 10.3% |
| Welsh | 97.3 /100 | #96 | Exceptional 10.3% |
| Czechoslovakians | 97.2 /100 | #97 | Exceptional 10.3% |
Demographics Similar to Immigrants from Senegal by Receiving Food Stamps
In terms of receiving food stamps, the demographic groups most similar to Immigrants from Senegal are Senegalese (15.4%, a difference of 0.27%), Immigrants from Belize (15.2%, a difference of 0.77%), Immigrants from Mexico (15.2%, a difference of 1.2%), Honduran (15.5%, a difference of 1.3%), and African (15.1%, a difference of 1.5%).
| Demographics | Rating | Rank | Receiving Food Stamps |
| Immigrants | Central America | 0.0 /100 | #282 | Tragic 15.0% |
| Bangladeshis | 0.0 /100 | #283 | Tragic 15.0% |
| Immigrants | Ecuador | 0.0 /100 | #284 | Tragic 15.0% |
| Immigrants | Liberia | 0.0 /100 | #285 | Tragic 15.1% |
| Africans | 0.0 /100 | #286 | Tragic 15.1% |
| Immigrants | Mexico | 0.0 /100 | #287 | Tragic 15.2% |
| Immigrants | Belize | 0.0 /100 | #288 | Tragic 15.2% |
| Immigrants | Senegal | 0.0 /100 | #289 | Tragic 15.3% |
| Senegalese | 0.0 /100 | #290 | Tragic 15.4% |
| Hondurans | 0.0 /100 | #291 | Tragic 15.5% |
| Alaska Natives | 0.0 /100 | #292 | Tragic 15.6% |
| Vietnamese | 0.0 /100 | #293 | Tragic 15.7% |
| Immigrants | Latin America | 0.0 /100 | #294 | Tragic 15.7% |
| Immigrants | Honduras | 0.0 /100 | #295 | Tragic 15.7% |
| Tsimshian | 0.0 /100 | #296 | Tragic 15.7% |