Assyrian/Chaldean/Syriac vs Immigrants from Sudan Receiving Food Stamps
COMPARE
Assyrian/Chaldean/Syriac
Immigrants from Sudan
Receiving Food Stamps
Receiving Food Stamps Comparison
Assyrians/Chaldeans/Syriacs
Immigrants from Sudan
10.6%
RECEIVING FOOD STAMPS
94.1/ 100
METRIC RATING
118th/ 347
METRIC RANK
12.1%
RECEIVING FOOD STAMPS
27.1/ 100
METRIC RATING
194th/ 347
METRIC RANK
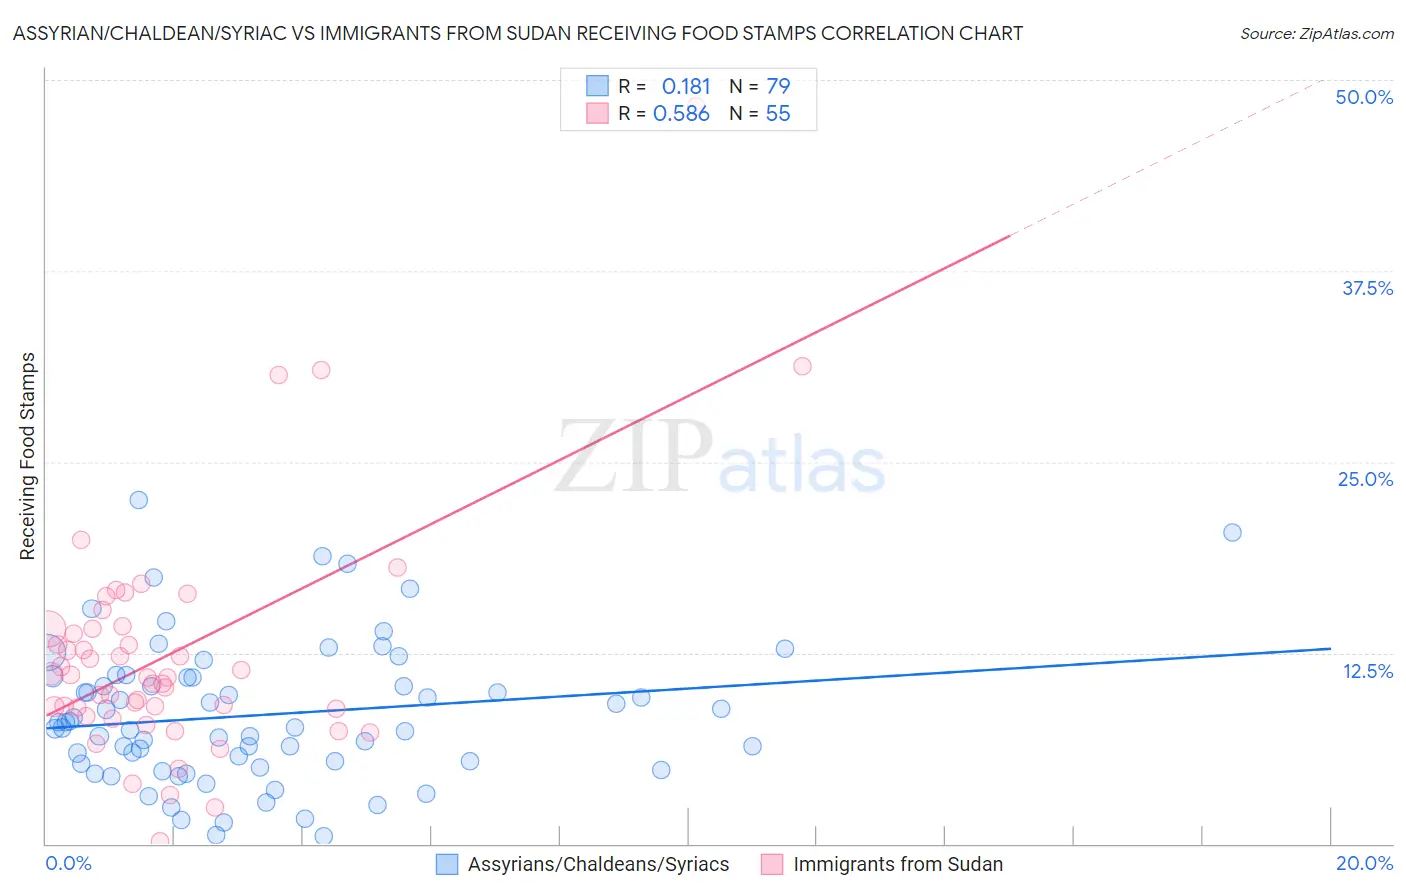
Assyrian/Chaldean/Syriac vs Immigrants from Sudan Receiving Food Stamps Correlation Chart
The statistical analysis conducted on geographies consisting of 110,240,637 people shows a poor positive correlation between the proportion of Assyrians/Chaldeans/Syriacs and percentage of population receiving government assistance and/or food stamps in the United States with a correlation coefficient (R) of 0.181 and weighted average of 10.6%. Similarly, the statistical analysis conducted on geographies consisting of 118,933,467 people shows a substantial positive correlation between the proportion of Immigrants from Sudan and percentage of population receiving government assistance and/or food stamps in the United States with a correlation coefficient (R) of 0.586 and weighted average of 12.1%, a difference of 14.6%.
Receiving Food Stamps Correlation Summary
| Measurement | Assyrian/Chaldean/Syriac | Immigrants from Sudan |
| Minimum | 0.50% | 0.20% |
| Maximum | 22.5% | 48.3% |
| Range | 22.0% | 48.1% |
| Mean | 8.4% | 12.5% |
| Median | 7.6% | 10.9% |
| Interquartile 25% (IQ1) | 5.2% | 8.8% |
| Interquartile 75% (IQ3) | 10.9% | 14.1% |
| Interquartile Range (IQR) | 5.7% | 5.3% |
| Standard Deviation (Sample) | 4.6% | 7.8% |
| Standard Deviation (Population) | 4.6% | 7.8% |
Similar Demographics by Receiving Food Stamps
Demographics Similar to Assyrians/Chaldeans/Syriacs by Receiving Food Stamps
In terms of receiving food stamps, the demographic groups most similar to Assyrians/Chaldeans/Syriacs are Immigrants from Poland (10.6%, a difference of 0.16%), Ethiopian (10.6%, a difference of 0.17%), Slavic (10.6%, a difference of 0.20%), Sri Lankan (10.6%, a difference of 0.27%), and Immigrants from Nepal (10.6%, a difference of 0.34%).
| Demographics | Rating | Rank | Receiving Food Stamps |
| Romanians | 95.8 /100 | #111 | Exceptional 10.4% |
| Mongolians | 95.8 /100 | #112 | Exceptional 10.5% |
| Icelanders | 95.4 /100 | #113 | Exceptional 10.5% |
| Scotch-Irish | 95.1 /100 | #114 | Exceptional 10.5% |
| Immigrants | Saudi Arabia | 94.9 /100 | #115 | Exceptional 10.5% |
| Canadians | 94.8 /100 | #116 | Exceptional 10.5% |
| Immigrants | Nepal | 94.6 /100 | #117 | Exceptional 10.6% |
| Assyrians/Chaldeans/Syriacs | 94.1 /100 | #118 | Exceptional 10.6% |
| Immigrants | Poland | 93.9 /100 | #119 | Exceptional 10.6% |
| Ethiopians | 93.9 /100 | #120 | Exceptional 10.6% |
| Slavs | 93.8 /100 | #121 | Exceptional 10.6% |
| Sri Lankans | 93.7 /100 | #122 | Exceptional 10.6% |
| Immigrants | Philippines | 93.3 /100 | #123 | Exceptional 10.7% |
| Paraguayans | 93.0 /100 | #124 | Exceptional 10.7% |
| Ukrainians | 92.8 /100 | #125 | Exceptional 10.7% |
Demographics Similar to Immigrants from Sudan by Receiving Food Stamps
In terms of receiving food stamps, the demographic groups most similar to Immigrants from Sudan are American (12.2%, a difference of 0.060%), Iraqi (12.2%, a difference of 0.090%), Immigrants from Fiji (12.1%, a difference of 0.12%), Delaware (12.2%, a difference of 0.17%), and Immigrants from Costa Rica (12.2%, a difference of 0.30%).
| Demographics | Rating | Rank | Receiving Food Stamps |
| Albanians | 35.4 /100 | #187 | Fair 12.0% |
| Sudanese | 33.4 /100 | #188 | Fair 12.0% |
| Immigrants | Cameroon | 32.5 /100 | #189 | Fair 12.0% |
| Immigrants | Peru | 32.2 /100 | #190 | Fair 12.0% |
| Venezuelans | 32.1 /100 | #191 | Fair 12.0% |
| Samoans | 31.0 /100 | #192 | Fair 12.1% |
| Immigrants | Fiji | 27.8 /100 | #193 | Fair 12.1% |
| Immigrants | Sudan | 27.1 /100 | #194 | Fair 12.1% |
| Americans | 26.7 /100 | #195 | Fair 12.2% |
| Iraqis | 26.6 /100 | #196 | Fair 12.2% |
| Delaware | 26.1 /100 | #197 | Fair 12.2% |
| Immigrants | Costa Rica | 25.4 /100 | #198 | Fair 12.2% |
| Portuguese | 25.1 /100 | #199 | Fair 12.2% |
| Sierra Leoneans | 23.6 /100 | #200 | Fair 12.2% |
| Ugandans | 22.5 /100 | #201 | Fair 12.2% |