Finnish vs Nicaraguan Receiving Food Stamps
COMPARE
Finnish
Nicaraguan
Receiving Food Stamps
Receiving Food Stamps Comparison
Finns
Nicaraguans
10.2%
RECEIVING FOOD STAMPS
97.9/ 100
METRIC RATING
90th/ 347
METRIC RANK
16.1%
RECEIVING FOOD STAMPS
0.0/ 100
METRIC RATING
303rd/ 347
METRIC RANK
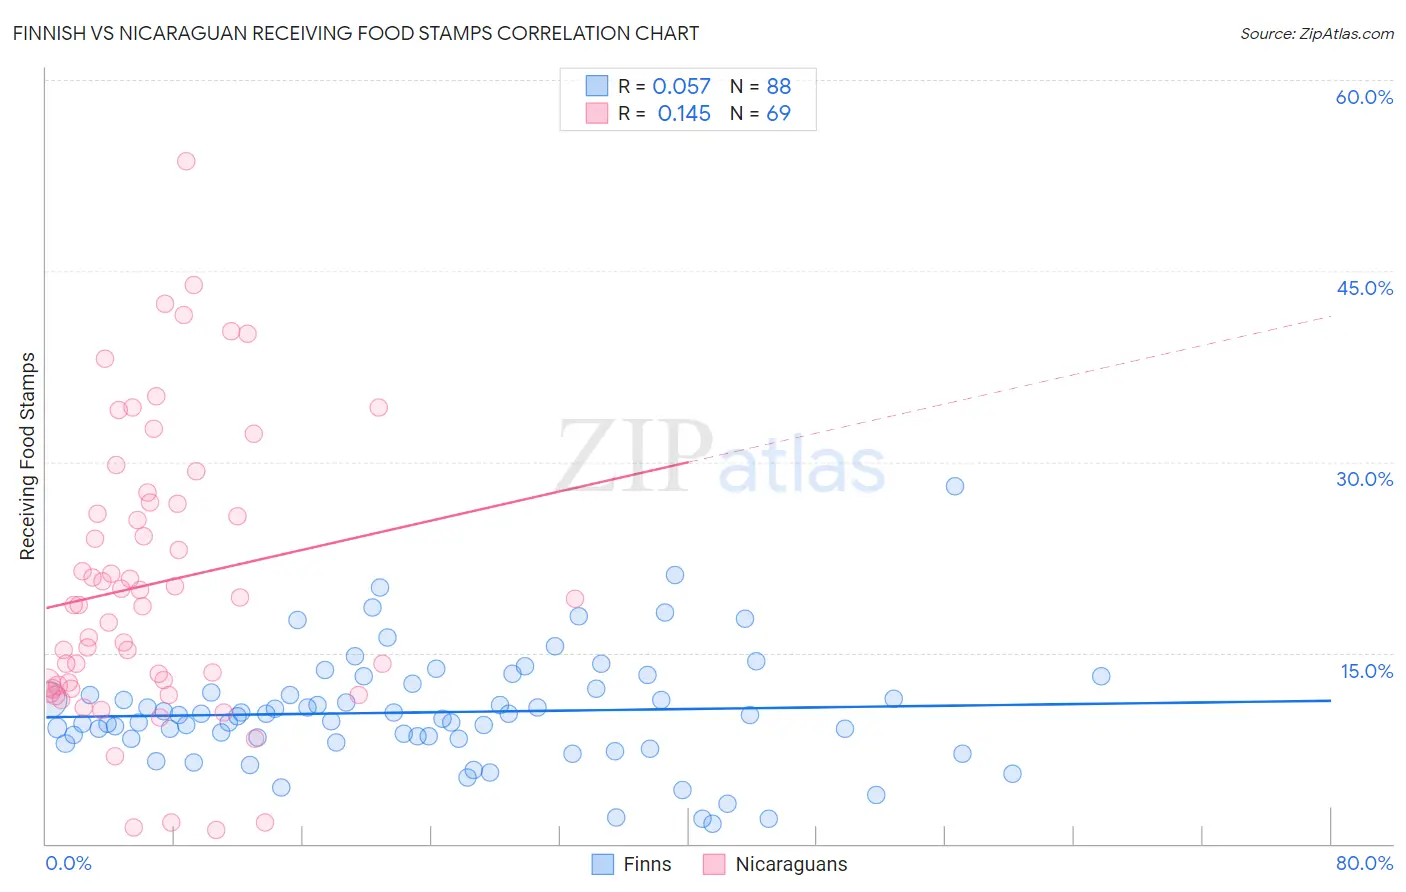
Finnish vs Nicaraguan Receiving Food Stamps Correlation Chart
The statistical analysis conducted on geographies consisting of 403,543,220 people shows a slight positive correlation between the proportion of Finns and percentage of population receiving government assistance and/or food stamps in the United States with a correlation coefficient (R) of 0.057 and weighted average of 10.2%. Similarly, the statistical analysis conducted on geographies consisting of 285,345,977 people shows a poor positive correlation between the proportion of Nicaraguans and percentage of population receiving government assistance and/or food stamps in the United States with a correlation coefficient (R) of 0.145 and weighted average of 16.1%, a difference of 58.9%.
Receiving Food Stamps Correlation Summary
| Measurement | Finnish | Nicaraguan |
| Minimum | 1.6% | 1.1% |
| Maximum | 28.1% | 53.6% |
| Range | 26.5% | 52.5% |
| Mean | 10.3% | 20.4% |
| Median | 10.0% | 18.7% |
| Interquartile 25% (IQ1) | 8.2% | 12.3% |
| Interquartile 75% (IQ3) | 12.0% | 26.7% |
| Interquartile Range (IQR) | 3.8% | 14.4% |
| Standard Deviation (Sample) | 4.4% | 11.2% |
| Standard Deviation (Population) | 4.4% | 11.1% |
Similar Demographics by Receiving Food Stamps
Demographics Similar to Finns by Receiving Food Stamps
In terms of receiving food stamps, the demographic groups most similar to Finns are Jordanian (10.2%, a difference of 0.040%), Irish (10.2%, a difference of 0.040%), Belgian (10.2%, a difference of 0.42%), Immigrants from France (10.1%, a difference of 0.85%), and Immigrants from Greece (10.3%, a difference of 0.95%).
| Demographics | Rating | Rank | Receiving Food Stamps |
| Dutch | 98.6 /100 | #83 | Exceptional 10.0% |
| Immigrants | Israel | 98.5 /100 | #84 | Exceptional 10.0% |
| Immigrants | Romania | 98.5 /100 | #85 | Exceptional 10.0% |
| Immigrants | Norway | 98.4 /100 | #86 | Exceptional 10.0% |
| Egyptians | 98.4 /100 | #87 | Exceptional 10.0% |
| Immigrants | Kuwait | 98.4 /100 | #88 | Exceptional 10.0% |
| Immigrants | France | 98.3 /100 | #89 | Exceptional 10.1% |
| Finns | 97.9 /100 | #90 | Exceptional 10.2% |
| Jordanians | 97.9 /100 | #91 | Exceptional 10.2% |
| Irish | 97.9 /100 | #92 | Exceptional 10.2% |
| Belgians | 97.7 /100 | #93 | Exceptional 10.2% |
| Immigrants | Greece | 97.4 /100 | #94 | Exceptional 10.3% |
| Basques | 97.4 /100 | #95 | Exceptional 10.3% |
| Welsh | 97.3 /100 | #96 | Exceptional 10.3% |
| Czechoslovakians | 97.2 /100 | #97 | Exceptional 10.3% |
Demographics Similar to Nicaraguans by Receiving Food Stamps
In terms of receiving food stamps, the demographic groups most similar to Nicaraguans are Immigrants from West Indies (16.1%, a difference of 0.090%), West Indian (16.3%, a difference of 0.68%), Trinidadian and Tobagonian (16.0%, a difference of 1.0%), Immigrants from Bangladesh (15.9%, a difference of 1.5%), and Immigrants from the Azores (16.4%, a difference of 1.6%).
| Demographics | Rating | Rank | Receiving Food Stamps |
| Tsimshian | 0.0 /100 | #296 | Tragic 15.7% |
| Immigrants | Bahamas | 0.0 /100 | #297 | Tragic 15.8% |
| Immigrants | Trinidad and Tobago | 0.0 /100 | #298 | Tragic 15.8% |
| Hispanics or Latinos | 0.0 /100 | #299 | Tragic 15.8% |
| Immigrants | Bangladesh | 0.0 /100 | #300 | Tragic 15.9% |
| Trinidadians and Tobagonians | 0.0 /100 | #301 | Tragic 16.0% |
| Immigrants | West Indies | 0.0 /100 | #302 | Tragic 16.1% |
| Nicaraguans | 0.0 /100 | #303 | Tragic 16.1% |
| West Indians | 0.0 /100 | #304 | Tragic 16.3% |
| Immigrants | Azores | 0.0 /100 | #305 | Tragic 16.4% |
| Jamaicans | 0.0 /100 | #306 | Tragic 16.4% |
| Houma | 0.0 /100 | #307 | Tragic 16.5% |
| Barbadians | 0.0 /100 | #308 | Tragic 16.5% |
| U.S. Virgin Islanders | 0.0 /100 | #309 | Tragic 16.5% |
| Immigrants | Barbados | 0.0 /100 | #310 | Tragic 16.6% |