Filipino vs Immigrants from Yemen Poverty
COMPARE
Filipino
Immigrants from Yemen
Poverty
Poverty Comparison
Filipinos
Immigrants from Yemen
10.1%
POVERTY
99.9/ 100
METRIC RATING
7th/ 347
METRIC RANK
21.5%
POVERTY
0.0/ 100
METRIC RATING
342nd/ 347
METRIC RANK
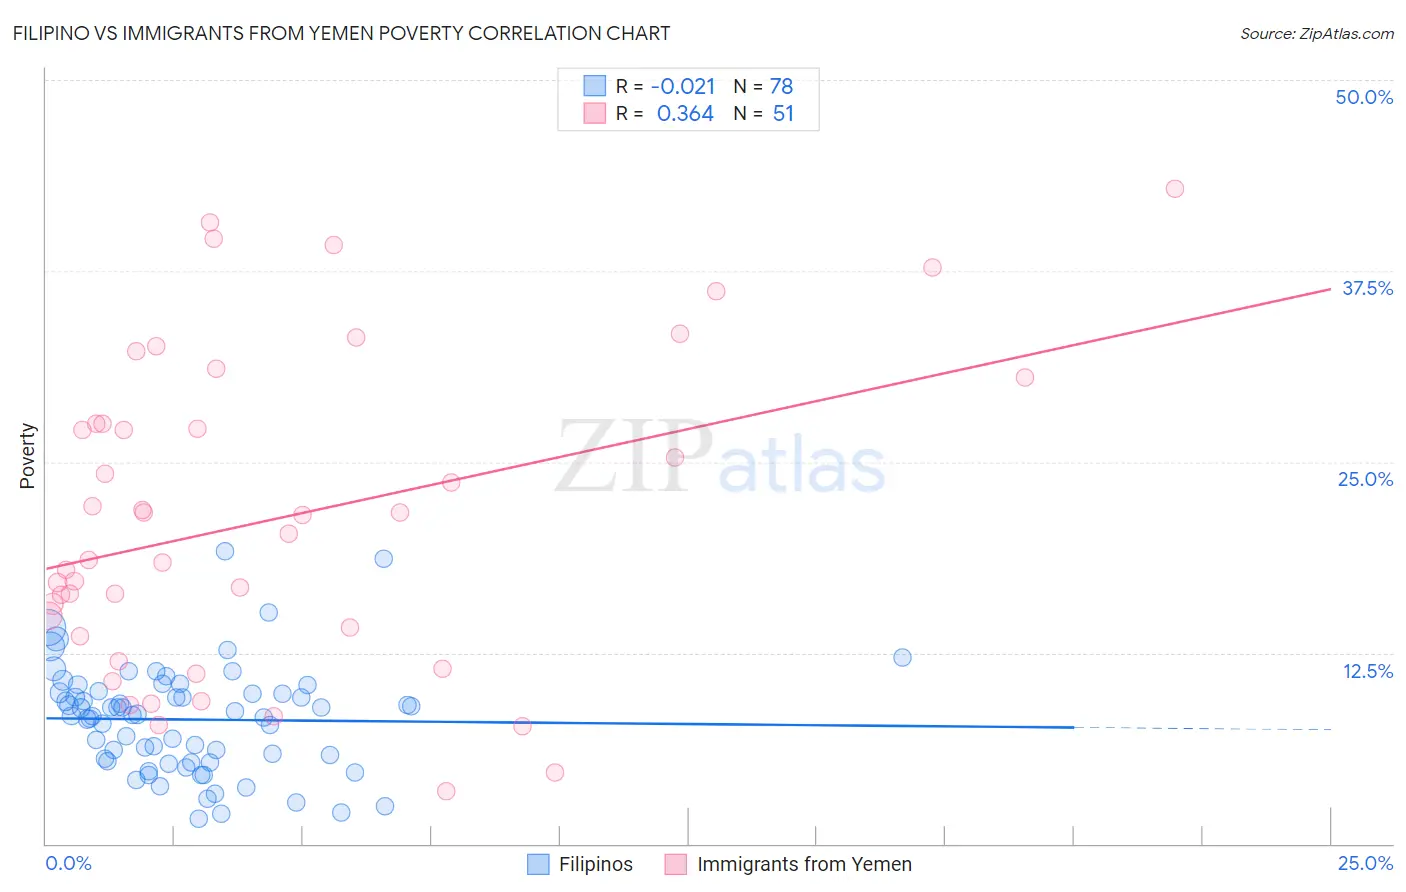
Filipino vs Immigrants from Yemen Poverty Correlation Chart
The statistical analysis conducted on geographies consisting of 254,160,394 people shows no correlation between the proportion of Filipinos and poverty level in the United States with a correlation coefficient (R) of -0.021 and weighted average of 10.1%. Similarly, the statistical analysis conducted on geographies consisting of 82,433,611 people shows a mild positive correlation between the proportion of Immigrants from Yemen and poverty level in the United States with a correlation coefficient (R) of 0.364 and weighted average of 21.5%, a difference of 112.6%.
Poverty Correlation Summary
| Measurement | Filipino | Immigrants from Yemen |
| Minimum | 1.6% | 3.5% |
| Maximum | 19.2% | 42.9% |
| Range | 17.6% | 39.4% |
| Mean | 8.1% | 21.3% |
| Median | 8.4% | 20.3% |
| Interquartile 25% (IQ1) | 5.4% | 13.6% |
| Interquartile 75% (IQ3) | 9.9% | 27.5% |
| Interquartile Range (IQR) | 4.5% | 13.9% |
| Standard Deviation (Sample) | 3.5% | 10.2% |
| Standard Deviation (Population) | 3.5% | 10.1% |
Similar Demographics by Poverty
Demographics Similar to Filipinos by Poverty
In terms of poverty, the demographic groups most similar to Filipinos are Assyrian/Chaldean/Syriac (10.1%, a difference of 0.14%), Immigrants from Ireland (10.1%, a difference of 0.32%), Maltese (10.2%, a difference of 0.42%), Immigrants from South Central Asia (10.2%, a difference of 0.87%), and Bulgarian (10.2%, a difference of 1.3%).
| Demographics | Rating | Rank | Poverty |
| Immigrants | India | 100.0 /100 | #1 | Exceptional 9.0% |
| Chinese | 100.0 /100 | #2 | Exceptional 9.5% |
| Thais | 100.0 /100 | #3 | Exceptional 9.6% |
| Immigrants | Taiwan | 100.0 /100 | #4 | Exceptional 9.7% |
| Immigrants | Ireland | 99.9 /100 | #5 | Exceptional 10.1% |
| Assyrians/Chaldeans/Syriacs | 99.9 /100 | #6 | Exceptional 10.1% |
| Filipinos | 99.9 /100 | #7 | Exceptional 10.1% |
| Maltese | 99.9 /100 | #8 | Exceptional 10.2% |
| Immigrants | South Central Asia | 99.9 /100 | #9 | Exceptional 10.2% |
| Bulgarians | 99.9 /100 | #10 | Exceptional 10.2% |
| Immigrants | Lithuania | 99.9 /100 | #11 | Exceptional 10.3% |
| Bhutanese | 99.8 /100 | #12 | Exceptional 10.4% |
| Immigrants | Hong Kong | 99.8 /100 | #13 | Exceptional 10.4% |
| Immigrants | Bolivia | 99.8 /100 | #14 | Exceptional 10.4% |
| Bolivians | 99.8 /100 | #15 | Exceptional 10.4% |
Demographics Similar to Immigrants from Yemen by Poverty
In terms of poverty, the demographic groups most similar to Immigrants from Yemen are Pima (21.9%, a difference of 1.6%), Lumbee (21.9%, a difference of 1.9%), Hopi (20.8%, a difference of 3.2%), Yup'ik (20.8%, a difference of 3.4%), and Crow (20.7%, a difference of 4.1%).
| Demographics | Rating | Rank | Poverty |
| Houma | 0.0 /100 | #333 | Tragic 18.4% |
| Apache | 0.0 /100 | #334 | Tragic 18.4% |
| Cheyenne | 0.0 /100 | #335 | Tragic 18.9% |
| Pueblo | 0.0 /100 | #336 | Tragic 19.4% |
| Sioux | 0.0 /100 | #337 | Tragic 19.8% |
| Yuman | 0.0 /100 | #338 | Tragic 20.2% |
| Crow | 0.0 /100 | #339 | Tragic 20.7% |
| Yup'ik | 0.0 /100 | #340 | Tragic 20.8% |
| Hopi | 0.0 /100 | #341 | Tragic 20.8% |
| Immigrants | Yemen | 0.0 /100 | #342 | Tragic 21.5% |
| Pima | 0.0 /100 | #343 | Tragic 21.9% |
| Lumbee | 0.0 /100 | #344 | Tragic 21.9% |
| Navajo | 0.0 /100 | #345 | Tragic 23.1% |
| Puerto Ricans | 0.0 /100 | #346 | Tragic 23.7% |
| Tohono O'odham | 0.0 /100 | #347 | Tragic 24.4% |