Immigrants from Bahamas vs Immigrants from Yemen Poverty
COMPARE
Immigrants from Bahamas
Immigrants from Yemen
Poverty
Poverty Comparison
Immigrants from Bahamas
Immigrants from Yemen
14.8%
POVERTY
0.0/ 100
METRIC RATING
276th/ 347
METRIC RANK
21.5%
POVERTY
0.0/ 100
METRIC RATING
342nd/ 347
METRIC RANK
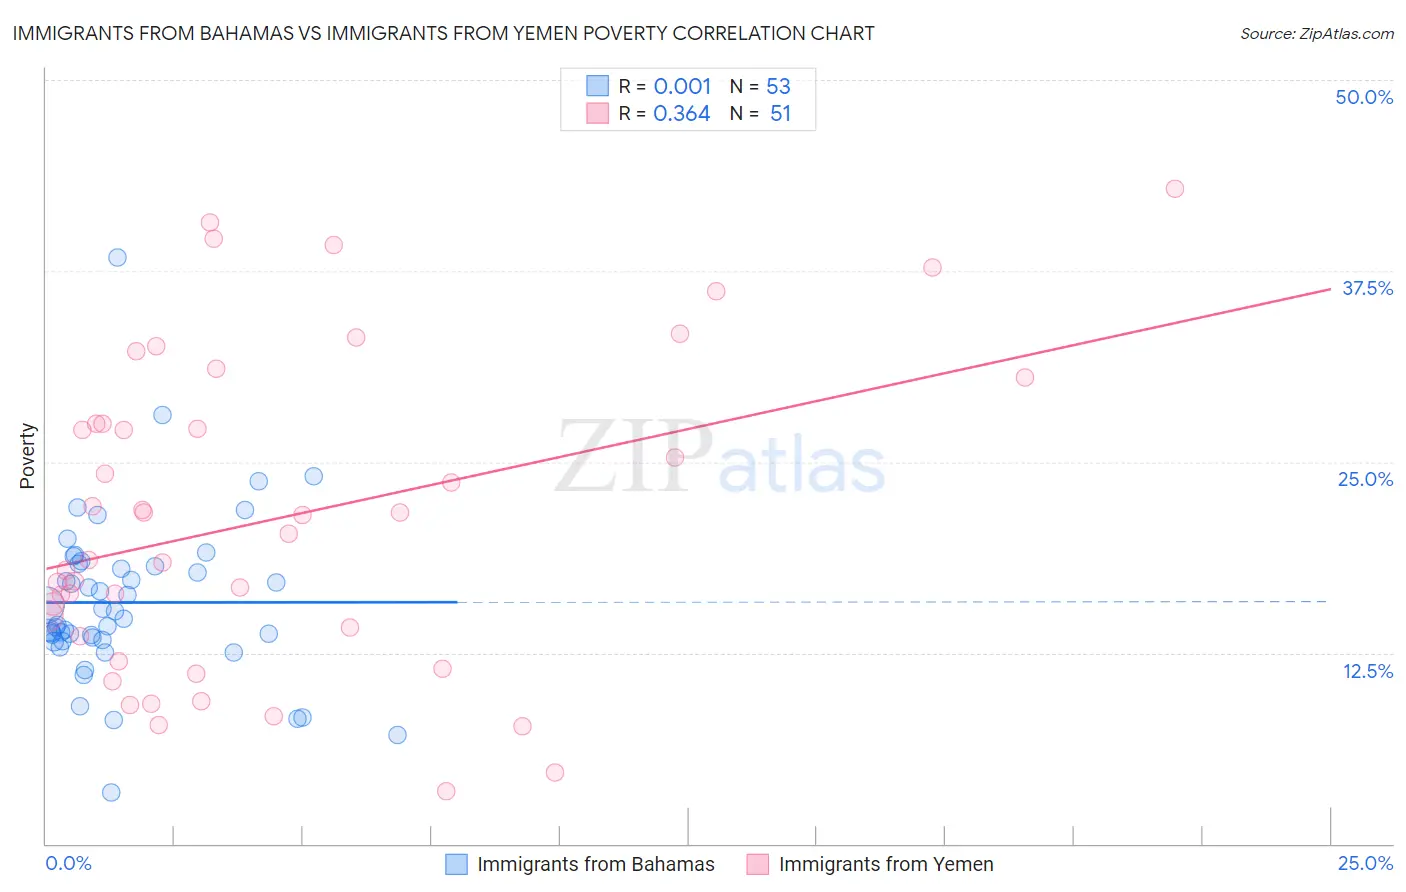
Immigrants from Bahamas vs Immigrants from Yemen Poverty Correlation Chart
The statistical analysis conducted on geographies consisting of 104,609,154 people shows no correlation between the proportion of Immigrants from Bahamas and poverty level in the United States with a correlation coefficient (R) of 0.001 and weighted average of 14.8%. Similarly, the statistical analysis conducted on geographies consisting of 82,433,611 people shows a mild positive correlation between the proportion of Immigrants from Yemen and poverty level in the United States with a correlation coefficient (R) of 0.364 and weighted average of 21.5%, a difference of 45.2%.
Poverty Correlation Summary
| Measurement | Immigrants from Bahamas | Immigrants from Yemen |
| Minimum | 3.4% | 3.5% |
| Maximum | 38.4% | 42.9% |
| Range | 35.0% | 39.4% |
| Mean | 15.8% | 21.3% |
| Median | 14.7% | 20.3% |
| Interquartile 25% (IQ1) | 13.3% | 13.6% |
| Interquartile 75% (IQ3) | 18.3% | 27.5% |
| Interquartile Range (IQR) | 5.0% | 13.9% |
| Standard Deviation (Sample) | 5.5% | 10.2% |
| Standard Deviation (Population) | 5.4% | 10.1% |
Similar Demographics by Poverty
Demographics Similar to Immigrants from Bahamas by Poverty
In terms of poverty, the demographic groups most similar to Immigrants from Bahamas are Immigrants from West Indies (14.8%, a difference of 0.0%), Barbadian (14.8%, a difference of 0.040%), Bangladeshi (14.8%, a difference of 0.050%), Belizean (14.8%, a difference of 0.070%), and Immigrants from St. Vincent and the Grenadines (14.9%, a difference of 0.37%).
| Demographics | Rating | Rank | Poverty |
| Immigrants | Cuba | 0.1 /100 | #269 | Tragic 14.6% |
| Central Americans | 0.1 /100 | #270 | Tragic 14.6% |
| Shoshone | 0.0 /100 | #271 | Tragic 14.7% |
| Chickasaw | 0.0 /100 | #272 | Tragic 14.7% |
| Spanish Americans | 0.0 /100 | #273 | Tragic 14.7% |
| Barbadians | 0.0 /100 | #274 | Tragic 14.8% |
| Immigrants | West Indies | 0.0 /100 | #275 | Tragic 14.8% |
| Immigrants | Bahamas | 0.0 /100 | #276 | Tragic 14.8% |
| Bangladeshis | 0.0 /100 | #277 | Tragic 14.8% |
| Belizeans | 0.0 /100 | #278 | Tragic 14.8% |
| Immigrants | St. Vincent and the Grenadines | 0.0 /100 | #279 | Tragic 14.9% |
| Haitians | 0.0 /100 | #280 | Tragic 14.9% |
| Immigrants | Barbados | 0.0 /100 | #281 | Tragic 14.9% |
| Comanche | 0.0 /100 | #282 | Tragic 15.0% |
| Immigrants | Haiti | 0.0 /100 | #283 | Tragic 15.0% |
Demographics Similar to Immigrants from Yemen by Poverty
In terms of poverty, the demographic groups most similar to Immigrants from Yemen are Pima (21.9%, a difference of 1.6%), Lumbee (21.9%, a difference of 1.9%), Hopi (20.8%, a difference of 3.2%), Yup'ik (20.8%, a difference of 3.4%), and Crow (20.7%, a difference of 4.1%).
| Demographics | Rating | Rank | Poverty |
| Houma | 0.0 /100 | #333 | Tragic 18.4% |
| Apache | 0.0 /100 | #334 | Tragic 18.4% |
| Cheyenne | 0.0 /100 | #335 | Tragic 18.9% |
| Pueblo | 0.0 /100 | #336 | Tragic 19.4% |
| Sioux | 0.0 /100 | #337 | Tragic 19.8% |
| Yuman | 0.0 /100 | #338 | Tragic 20.2% |
| Crow | 0.0 /100 | #339 | Tragic 20.7% |
| Yup'ik | 0.0 /100 | #340 | Tragic 20.8% |
| Hopi | 0.0 /100 | #341 | Tragic 20.8% |
| Immigrants | Yemen | 0.0 /100 | #342 | Tragic 21.5% |
| Pima | 0.0 /100 | #343 | Tragic 21.9% |
| Lumbee | 0.0 /100 | #344 | Tragic 21.9% |
| Navajo | 0.0 /100 | #345 | Tragic 23.1% |
| Puerto Ricans | 0.0 /100 | #346 | Tragic 23.7% |
| Tohono O'odham | 0.0 /100 | #347 | Tragic 24.4% |