Filipino vs Sri Lankan Poverty
COMPARE
Filipino
Sri Lankan
Poverty
Poverty Comparison
Filipinos
Sri Lankans
10.1%
POVERTY
99.9/ 100
METRIC RATING
7th/ 347
METRIC RANK
11.7%
POVERTY
89.4/ 100
METRIC RATING
117th/ 347
METRIC RANK
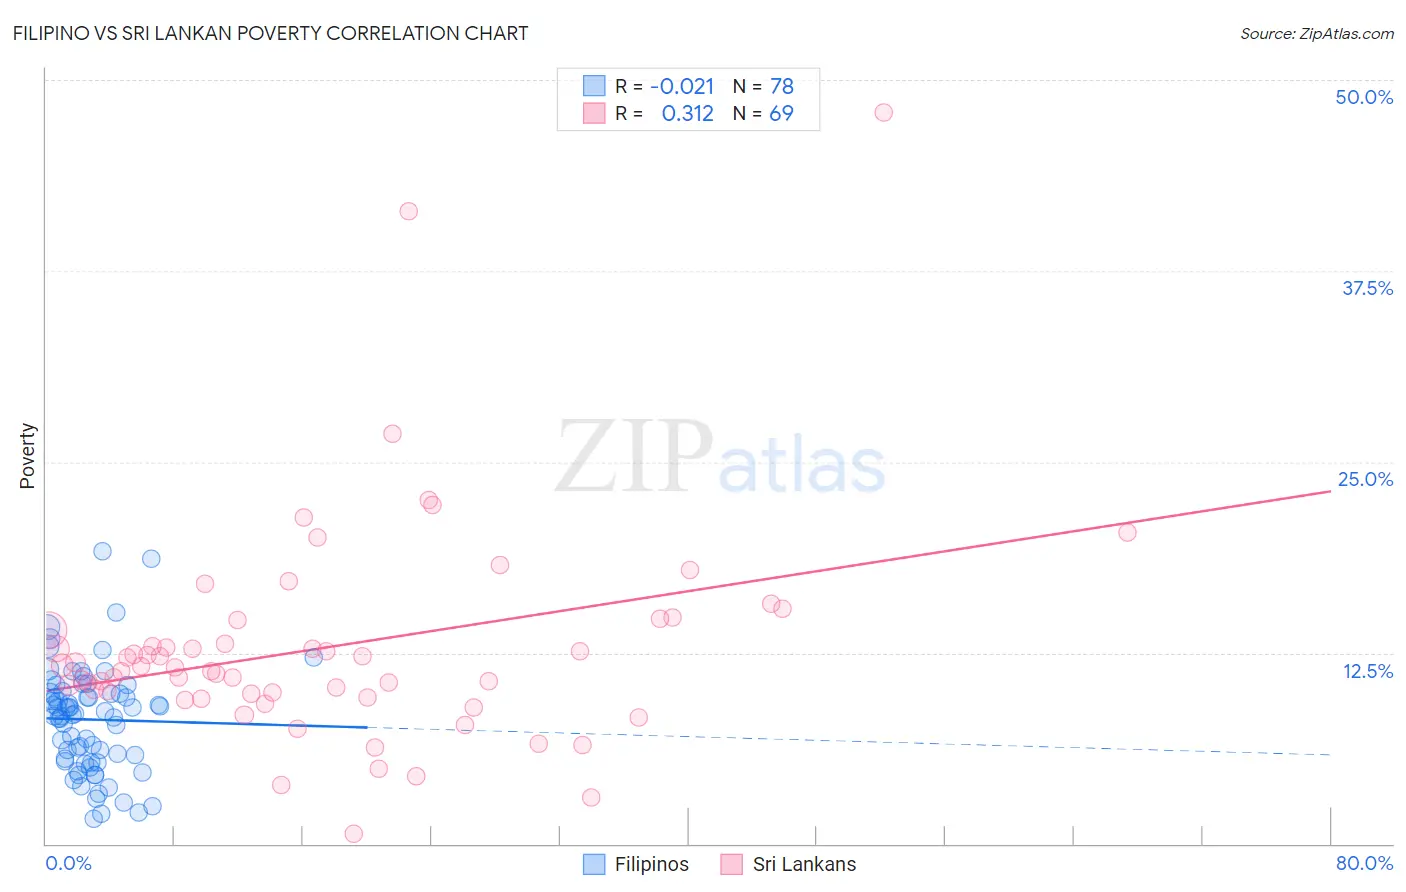
Filipino vs Sri Lankan Poverty Correlation Chart
The statistical analysis conducted on geographies consisting of 254,160,394 people shows no correlation between the proportion of Filipinos and poverty level in the United States with a correlation coefficient (R) of -0.021 and weighted average of 10.1%. Similarly, the statistical analysis conducted on geographies consisting of 440,138,450 people shows a mild positive correlation between the proportion of Sri Lankans and poverty level in the United States with a correlation coefficient (R) of 0.312 and weighted average of 11.7%, a difference of 15.5%.
Poverty Correlation Summary
| Measurement | Filipino | Sri Lankan |
| Minimum | 1.6% | 0.64% |
| Maximum | 19.2% | 47.9% |
| Range | 17.6% | 47.2% |
| Mean | 8.1% | 12.9% |
| Median | 8.4% | 11.5% |
| Interquartile 25% (IQ1) | 5.4% | 9.7% |
| Interquartile 75% (IQ3) | 9.9% | 14.3% |
| Interquartile Range (IQR) | 4.5% | 4.6% |
| Standard Deviation (Sample) | 3.5% | 7.2% |
| Standard Deviation (Population) | 3.5% | 7.2% |
Similar Demographics by Poverty
Demographics Similar to Filipinos by Poverty
In terms of poverty, the demographic groups most similar to Filipinos are Assyrian/Chaldean/Syriac (10.1%, a difference of 0.14%), Immigrants from Ireland (10.1%, a difference of 0.32%), Maltese (10.2%, a difference of 0.42%), Immigrants from South Central Asia (10.2%, a difference of 0.87%), and Bulgarian (10.2%, a difference of 1.3%).
| Demographics | Rating | Rank | Poverty |
| Immigrants | India | 100.0 /100 | #1 | Exceptional 9.0% |
| Chinese | 100.0 /100 | #2 | Exceptional 9.5% |
| Thais | 100.0 /100 | #3 | Exceptional 9.6% |
| Immigrants | Taiwan | 100.0 /100 | #4 | Exceptional 9.7% |
| Immigrants | Ireland | 99.9 /100 | #5 | Exceptional 10.1% |
| Assyrians/Chaldeans/Syriacs | 99.9 /100 | #6 | Exceptional 10.1% |
| Filipinos | 99.9 /100 | #7 | Exceptional 10.1% |
| Maltese | 99.9 /100 | #8 | Exceptional 10.2% |
| Immigrants | South Central Asia | 99.9 /100 | #9 | Exceptional 10.2% |
| Bulgarians | 99.9 /100 | #10 | Exceptional 10.2% |
| Immigrants | Lithuania | 99.9 /100 | #11 | Exceptional 10.3% |
| Bhutanese | 99.8 /100 | #12 | Exceptional 10.4% |
| Immigrants | Hong Kong | 99.8 /100 | #13 | Exceptional 10.4% |
| Immigrants | Bolivia | 99.8 /100 | #14 | Exceptional 10.4% |
| Bolivians | 99.8 /100 | #15 | Exceptional 10.4% |
Demographics Similar to Sri Lankans by Poverty
In terms of poverty, the demographic groups most similar to Sri Lankans are Immigrants from Russia (11.7%, a difference of 0.070%), Argentinean (11.7%, a difference of 0.080%), Tlingit-Haida (11.7%, a difference of 0.12%), Immigrants from South Eastern Asia (11.7%, a difference of 0.13%), and New Zealander (11.7%, a difference of 0.19%).
| Demographics | Rating | Rank | Poverty |
| Welsh | 91.6 /100 | #110 | Exceptional 11.6% |
| French Canadians | 91.0 /100 | #111 | Exceptional 11.6% |
| Immigrants | Southern Europe | 90.8 /100 | #112 | Exceptional 11.6% |
| Immigrants | Belarus | 90.8 /100 | #113 | Exceptional 11.6% |
| Immigrants | China | 90.7 /100 | #114 | Exceptional 11.6% |
| Albanians | 90.3 /100 | #115 | Exceptional 11.7% |
| Immigrants | Russia | 89.7 /100 | #116 | Excellent 11.7% |
| Sri Lankans | 89.4 /100 | #117 | Excellent 11.7% |
| Argentineans | 89.1 /100 | #118 | Excellent 11.7% |
| Tlingit-Haida | 89.0 /100 | #119 | Excellent 11.7% |
| Immigrants | South Eastern Asia | 88.9 /100 | #120 | Excellent 11.7% |
| New Zealanders | 88.7 /100 | #121 | Excellent 11.7% |
| Puget Sound Salish | 88.7 /100 | #122 | Excellent 11.7% |
| Immigrants | Hungary | 88.6 /100 | #123 | Excellent 11.7% |
| Soviet Union | 88.4 /100 | #124 | Excellent 11.7% |