Filipino vs Immigrants from Yemen Unemployment Among Women with Children Ages 6 to 17 years
COMPARE
Filipino
Immigrants from Yemen
Unemployment Among Women with Children Ages 6 to 17 years
Unemployment Among Women with Children Ages 6 to 17 years Comparison
Filipinos
Immigrants from Yemen
7.6%
UNEMPLOYMENT AMONG WOMEN WITH CHILDREN AGES 6 TO 17 YEARS
100.0/ 100
METRIC RATING
19th/ 347
METRIC RANK
12.7%
UNEMPLOYMENT AMONG WOMEN WITH CHILDREN AGES 6 TO 17 YEARS
0.0/ 100
METRIC RATING
337th/ 347
METRIC RANK
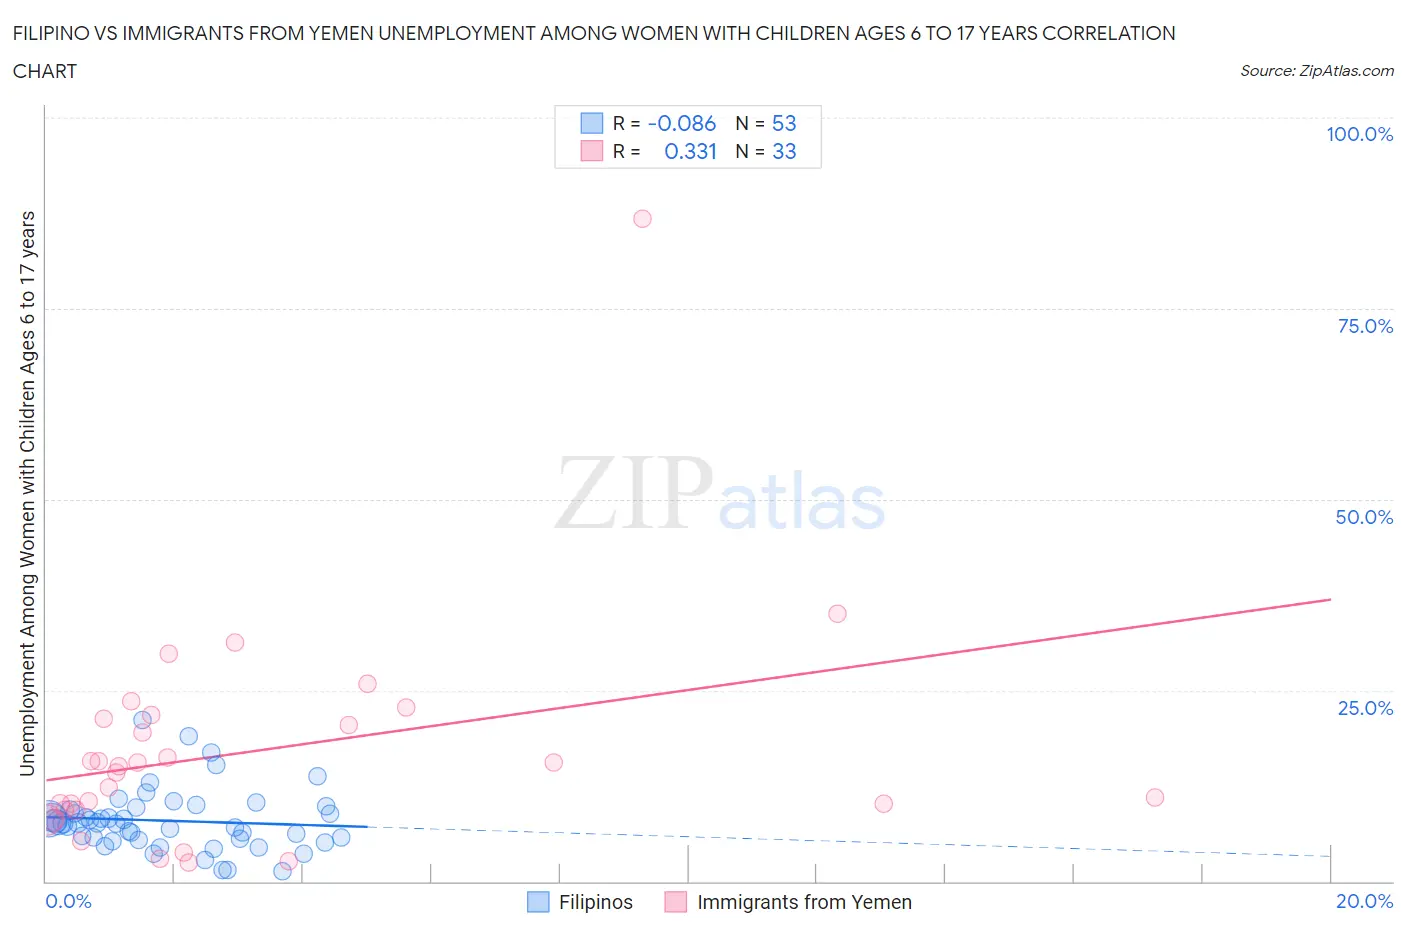
Filipino vs Immigrants from Yemen Unemployment Among Women with Children Ages 6 to 17 years Correlation Chart
The statistical analysis conducted on geographies consisting of 196,913,361 people shows a slight negative correlation between the proportion of Filipinos and unemployment rate among women with children between the ages 6 and 17 in the United States with a correlation coefficient (R) of -0.086 and weighted average of 7.6%. Similarly, the statistical analysis conducted on geographies consisting of 75,031,826 people shows a mild positive correlation between the proportion of Immigrants from Yemen and unemployment rate among women with children between the ages 6 and 17 in the United States with a correlation coefficient (R) of 0.331 and weighted average of 12.7%, a difference of 67.7%.
Unemployment Among Women with Children Ages 6 to 17 years Correlation Summary
| Measurement | Filipino | Immigrants from Yemen |
| Minimum | 1.3% | 2.4% |
| Maximum | 21.1% | 86.7% |
| Range | 19.8% | 84.3% |
| Mean | 7.9% | 17.0% |
| Median | 7.6% | 15.1% |
| Interquartile 25% (IQ1) | 5.5% | 9.3% |
| Interquartile 75% (IQ3) | 9.5% | 21.5% |
| Interquartile Range (IQR) | 4.0% | 12.2% |
| Standard Deviation (Sample) | 4.0% | 15.0% |
| Standard Deviation (Population) | 3.9% | 14.8% |
Similar Demographics by Unemployment Among Women with Children Ages 6 to 17 years
Demographics Similar to Filipinos by Unemployment Among Women with Children Ages 6 to 17 years
In terms of unemployment among women with children ages 6 to 17 years, the demographic groups most similar to Filipinos are Afghan (7.6%, a difference of 0.020%), Cambodian (7.5%, a difference of 0.68%), Immigrants from Burma/Myanmar (7.5%, a difference of 0.86%), Immigrants from Singapore (7.7%, a difference of 1.0%), and Immigrants from India (7.7%, a difference of 1.1%).
| Demographics | Rating | Rank | Unemployment Among Women with Children Ages 6 to 17 years |
| Bangladeshis | 100.0 /100 | #12 | Exceptional 7.4% |
| Indonesians | 100.0 /100 | #13 | Exceptional 7.4% |
| Sudanese | 100.0 /100 | #14 | Exceptional 7.4% |
| Puget Sound Salish | 100.0 /100 | #15 | Exceptional 7.5% |
| Immigrants | Burma/Myanmar | 100.0 /100 | #16 | Exceptional 7.5% |
| Cambodians | 100.0 /100 | #17 | Exceptional 7.5% |
| Afghans | 100.0 /100 | #18 | Exceptional 7.6% |
| Filipinos | 100.0 /100 | #19 | Exceptional 7.6% |
| Immigrants | Singapore | 100.0 /100 | #20 | Exceptional 7.7% |
| Immigrants | India | 100.0 /100 | #21 | Exceptional 7.7% |
| Immigrants | China | 100.0 /100 | #22 | Exceptional 7.7% |
| Immigrants | Indonesia | 100.0 /100 | #23 | Exceptional 7.7% |
| Nepalese | 100.0 /100 | #24 | Exceptional 7.7% |
| Immigrants | Eastern Asia | 100.0 /100 | #25 | Exceptional 7.7% |
| Indians (Asian) | 100.0 /100 | #26 | Exceptional 7.7% |
Demographics Similar to Immigrants from Yemen by Unemployment Among Women with Children Ages 6 to 17 years
In terms of unemployment among women with children ages 6 to 17 years, the demographic groups most similar to Immigrants from Yemen are Hopi (12.9%, a difference of 1.5%), Houma (12.5%, a difference of 1.9%), Colville (12.3%, a difference of 2.9%), Sioux (13.2%, a difference of 4.2%), and Ugandan (12.0%, a difference of 5.7%).
| Demographics | Rating | Rank | Unemployment Among Women with Children Ages 6 to 17 years |
| Chippewa | 0.0 /100 | #330 | Tragic 11.1% |
| Blacks/African Americans | 0.0 /100 | #331 | Tragic 11.4% |
| Tsimshian | 0.0 /100 | #332 | Tragic 11.4% |
| Natives/Alaskans | 0.0 /100 | #333 | Tragic 11.5% |
| Ugandans | 0.0 /100 | #334 | Tragic 12.0% |
| Colville | 0.0 /100 | #335 | Tragic 12.3% |
| Houma | 0.0 /100 | #336 | Tragic 12.5% |
| Immigrants | Yemen | 0.0 /100 | #337 | Tragic 12.7% |
| Hopi | 0.0 /100 | #338 | Tragic 12.9% |
| Sioux | 0.0 /100 | #339 | Tragic 13.2% |
| Puerto Ricans | 0.0 /100 | #340 | Tragic 13.9% |
| Navajo | 0.0 /100 | #341 | Tragic 14.2% |
| Yuman | 0.0 /100 | #342 | Tragic 14.8% |
| Inupiat | 0.0 /100 | #343 | Tragic 14.9% |
| Cheyenne | 0.0 /100 | #344 | Tragic 16.4% |