Filipino vs Immigrants from Pakistan Poverty
COMPARE
Filipino
Immigrants from Pakistan
Poverty
Poverty Comparison
Filipinos
Immigrants from Pakistan
10.1%
POVERTY
99.9/ 100
METRIC RATING
7th/ 347
METRIC RANK
10.8%
POVERTY
99.3/ 100
METRIC RATING
39th/ 347
METRIC RANK
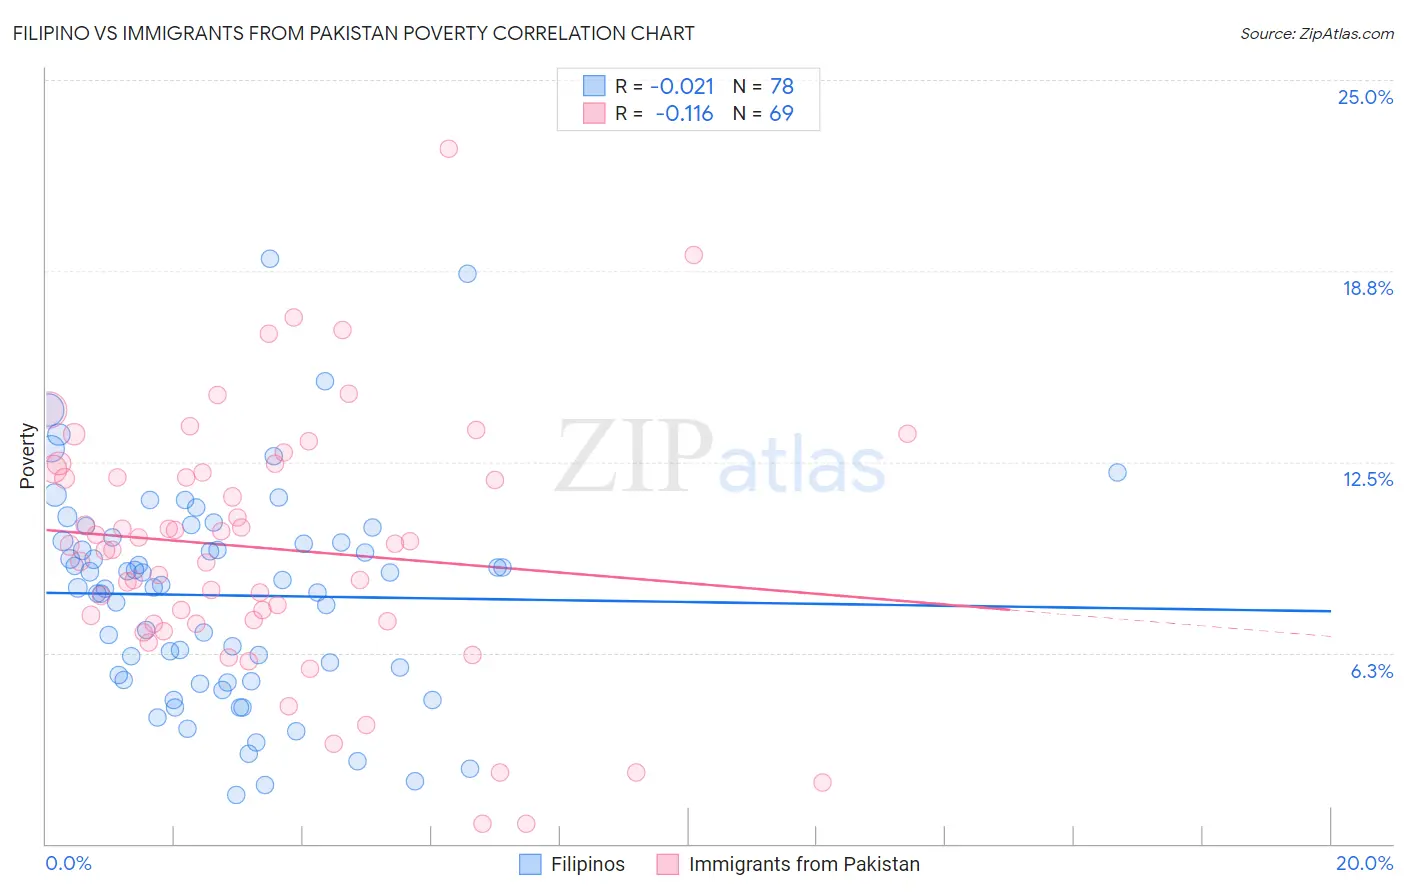
Filipino vs Immigrants from Pakistan Poverty Correlation Chart
The statistical analysis conducted on geographies consisting of 254,160,394 people shows no correlation between the proportion of Filipinos and poverty level in the United States with a correlation coefficient (R) of -0.021 and weighted average of 10.1%. Similarly, the statistical analysis conducted on geographies consisting of 283,811,993 people shows a poor negative correlation between the proportion of Immigrants from Pakistan and poverty level in the United States with a correlation coefficient (R) of -0.116 and weighted average of 10.8%, a difference of 7.2%.
Poverty Correlation Summary
| Measurement | Filipino | Immigrants from Pakistan |
| Minimum | 1.6% | 0.64% |
| Maximum | 19.2% | 22.7% |
| Range | 17.6% | 22.1% |
| Mean | 8.1% | 9.7% |
| Median | 8.4% | 9.8% |
| Interquartile 25% (IQ1) | 5.4% | 7.2% |
| Interquartile 75% (IQ3) | 9.9% | 12.2% |
| Interquartile Range (IQR) | 4.5% | 5.0% |
| Standard Deviation (Sample) | 3.5% | 4.2% |
| Standard Deviation (Population) | 3.5% | 4.1% |
Similar Demographics by Poverty
Demographics Similar to Filipinos by Poverty
In terms of poverty, the demographic groups most similar to Filipinos are Assyrian/Chaldean/Syriac (10.1%, a difference of 0.14%), Immigrants from Ireland (10.1%, a difference of 0.32%), Maltese (10.2%, a difference of 0.42%), Immigrants from South Central Asia (10.2%, a difference of 0.87%), and Bulgarian (10.2%, a difference of 1.3%).
| Demographics | Rating | Rank | Poverty |
| Immigrants | India | 100.0 /100 | #1 | Exceptional 9.0% |
| Chinese | 100.0 /100 | #2 | Exceptional 9.5% |
| Thais | 100.0 /100 | #3 | Exceptional 9.6% |
| Immigrants | Taiwan | 100.0 /100 | #4 | Exceptional 9.7% |
| Immigrants | Ireland | 99.9 /100 | #5 | Exceptional 10.1% |
| Assyrians/Chaldeans/Syriacs | 99.9 /100 | #6 | Exceptional 10.1% |
| Filipinos | 99.9 /100 | #7 | Exceptional 10.1% |
| Maltese | 99.9 /100 | #8 | Exceptional 10.2% |
| Immigrants | South Central Asia | 99.9 /100 | #9 | Exceptional 10.2% |
| Bulgarians | 99.9 /100 | #10 | Exceptional 10.2% |
| Immigrants | Lithuania | 99.9 /100 | #11 | Exceptional 10.3% |
| Bhutanese | 99.8 /100 | #12 | Exceptional 10.4% |
| Immigrants | Hong Kong | 99.8 /100 | #13 | Exceptional 10.4% |
| Immigrants | Bolivia | 99.8 /100 | #14 | Exceptional 10.4% |
| Bolivians | 99.8 /100 | #15 | Exceptional 10.4% |
Demographics Similar to Immigrants from Pakistan by Poverty
In terms of poverty, the demographic groups most similar to Immigrants from Pakistan are Russian (10.9%, a difference of 0.050%), Czech (10.8%, a difference of 0.080%), Immigrants from Greece (10.8%, a difference of 0.13%), Immigrants from Iran (10.9%, a difference of 0.14%), and Cypriot (10.8%, a difference of 0.22%).
| Demographics | Rating | Rank | Poverty |
| Iranians | 99.5 /100 | #32 | Exceptional 10.7% |
| Macedonians | 99.4 /100 | #33 | Exceptional 10.8% |
| Immigrants | Poland | 99.4 /100 | #34 | Exceptional 10.8% |
| Tongans | 99.4 /100 | #35 | Exceptional 10.8% |
| Cypriots | 99.3 /100 | #36 | Exceptional 10.8% |
| Immigrants | Greece | 99.3 /100 | #37 | Exceptional 10.8% |
| Czechs | 99.3 /100 | #38 | Exceptional 10.8% |
| Immigrants | Pakistan | 99.3 /100 | #39 | Exceptional 10.8% |
| Russians | 99.3 /100 | #40 | Exceptional 10.9% |
| Immigrants | Iran | 99.2 /100 | #41 | Exceptional 10.9% |
| Koreans | 99.2 /100 | #42 | Exceptional 10.9% |
| Immigrants | Singapore | 99.2 /100 | #43 | Exceptional 10.9% |
| Immigrants | Moldova | 99.1 /100 | #44 | Exceptional 10.9% |
| Turks | 98.9 /100 | #45 | Exceptional 11.0% |
| Immigrants | Czechoslovakia | 98.9 /100 | #46 | Exceptional 11.0% |