Filipino vs Vietnamese Poverty
COMPARE
Filipino
Vietnamese
Poverty
Poverty Comparison
Filipinos
Vietnamese
10.1%
POVERTY
99.9/ 100
METRIC RATING
7th/ 347
METRIC RANK
15.0%
POVERTY
0.0/ 100
METRIC RATING
285th/ 347
METRIC RANK
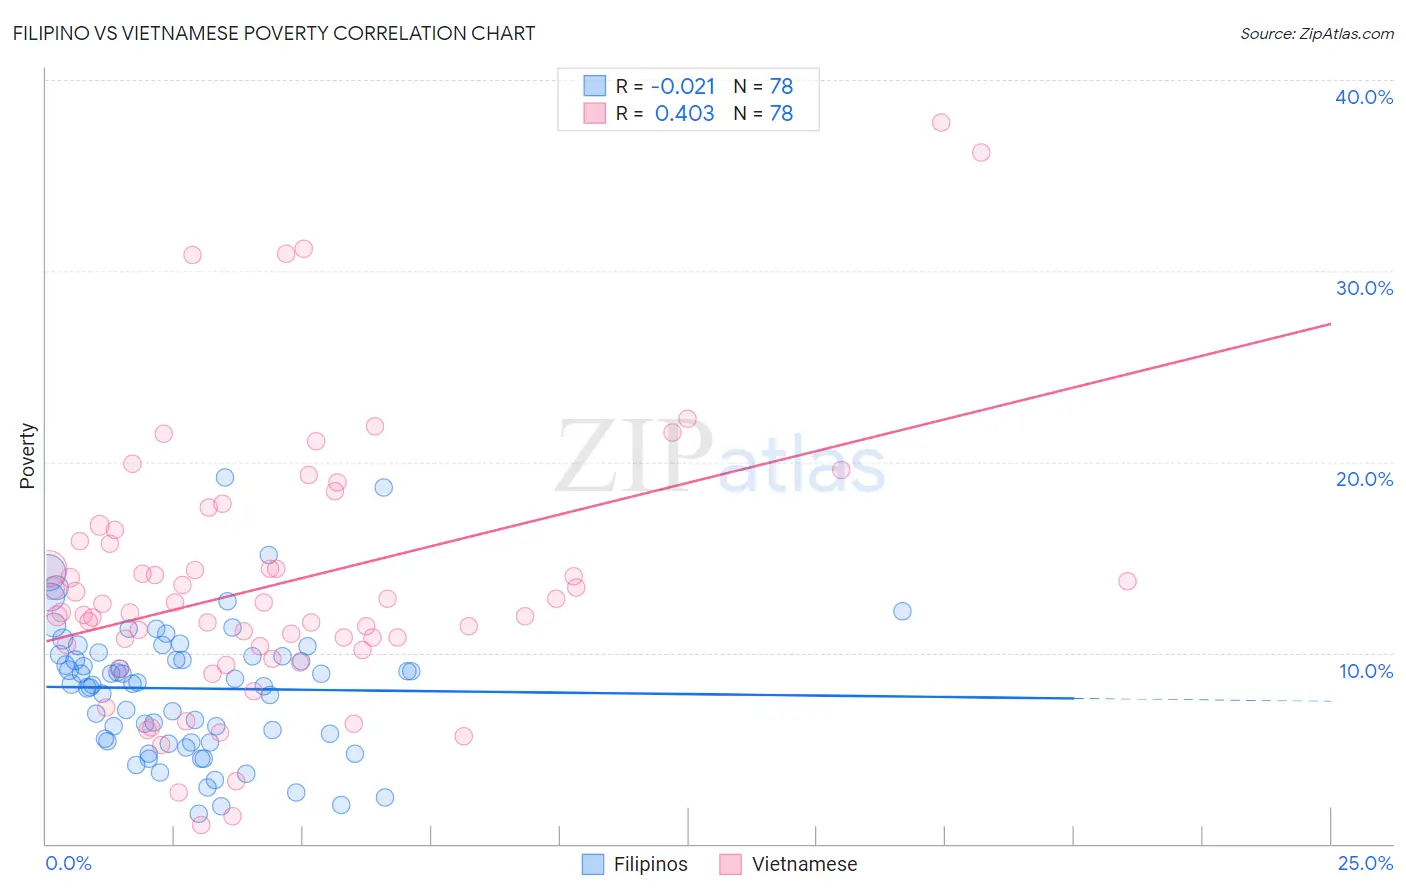
Filipino vs Vietnamese Poverty Correlation Chart
The statistical analysis conducted on geographies consisting of 254,160,394 people shows no correlation between the proportion of Filipinos and poverty level in the United States with a correlation coefficient (R) of -0.021 and weighted average of 10.1%. Similarly, the statistical analysis conducted on geographies consisting of 170,677,568 people shows a moderate positive correlation between the proportion of Vietnamese and poverty level in the United States with a correlation coefficient (R) of 0.403 and weighted average of 15.0%, a difference of 48.2%.
Poverty Correlation Summary
| Measurement | Filipino | Vietnamese |
| Minimum | 1.6% | 1.0% |
| Maximum | 19.2% | 37.7% |
| Range | 17.6% | 36.7% |
| Mean | 8.1% | 13.6% |
| Median | 8.4% | 12.3% |
| Interquartile 25% (IQ1) | 5.4% | 10.4% |
| Interquartile 75% (IQ3) | 9.9% | 15.9% |
| Interquartile Range (IQR) | 4.5% | 5.5% |
| Standard Deviation (Sample) | 3.5% | 7.0% |
| Standard Deviation (Population) | 3.5% | 7.0% |
Similar Demographics by Poverty
Demographics Similar to Filipinos by Poverty
In terms of poverty, the demographic groups most similar to Filipinos are Assyrian/Chaldean/Syriac (10.1%, a difference of 0.14%), Immigrants from Ireland (10.1%, a difference of 0.32%), Maltese (10.2%, a difference of 0.42%), Immigrants from South Central Asia (10.2%, a difference of 0.87%), and Bulgarian (10.2%, a difference of 1.3%).
| Demographics | Rating | Rank | Poverty |
| Immigrants | India | 100.0 /100 | #1 | Exceptional 9.0% |
| Chinese | 100.0 /100 | #2 | Exceptional 9.5% |
| Thais | 100.0 /100 | #3 | Exceptional 9.6% |
| Immigrants | Taiwan | 100.0 /100 | #4 | Exceptional 9.7% |
| Immigrants | Ireland | 99.9 /100 | #5 | Exceptional 10.1% |
| Assyrians/Chaldeans/Syriacs | 99.9 /100 | #6 | Exceptional 10.1% |
| Filipinos | 99.9 /100 | #7 | Exceptional 10.1% |
| Maltese | 99.9 /100 | #8 | Exceptional 10.2% |
| Immigrants | South Central Asia | 99.9 /100 | #9 | Exceptional 10.2% |
| Bulgarians | 99.9 /100 | #10 | Exceptional 10.2% |
| Immigrants | Lithuania | 99.9 /100 | #11 | Exceptional 10.3% |
| Bhutanese | 99.8 /100 | #12 | Exceptional 10.4% |
| Immigrants | Hong Kong | 99.8 /100 | #13 | Exceptional 10.4% |
| Immigrants | Bolivia | 99.8 /100 | #14 | Exceptional 10.4% |
| Bolivians | 99.8 /100 | #15 | Exceptional 10.4% |
Demographics Similar to Vietnamese by Poverty
In terms of poverty, the demographic groups most similar to Vietnamese are West Indian (15.0%, a difference of 0.050%), Immigrants from Haiti (15.0%, a difference of 0.16%), Immigrants from Latin America (15.0%, a difference of 0.26%), Comanche (15.0%, a difference of 0.28%), and Inupiat (15.1%, a difference of 0.47%).
| Demographics | Rating | Rank | Poverty |
| Belizeans | 0.0 /100 | #278 | Tragic 14.8% |
| Immigrants | St. Vincent and the Grenadines | 0.0 /100 | #279 | Tragic 14.9% |
| Haitians | 0.0 /100 | #280 | Tragic 14.9% |
| Immigrants | Barbados | 0.0 /100 | #281 | Tragic 14.9% |
| Comanche | 0.0 /100 | #282 | Tragic 15.0% |
| Immigrants | Haiti | 0.0 /100 | #283 | Tragic 15.0% |
| West Indians | 0.0 /100 | #284 | Tragic 15.0% |
| Vietnamese | 0.0 /100 | #285 | Tragic 15.0% |
| Immigrants | Latin America | 0.0 /100 | #286 | Tragic 15.0% |
| Inupiat | 0.0 /100 | #287 | Tragic 15.1% |
| Yaqui | 0.0 /100 | #288 | Tragic 15.1% |
| Immigrants | Belize | 0.0 /100 | #289 | Tragic 15.1% |
| Mexicans | 0.0 /100 | #290 | Tragic 15.1% |
| Immigrants | Cabo Verde | 0.0 /100 | #291 | Tragic 15.1% |
| Indonesians | 0.0 /100 | #292 | Tragic 15.1% |