South African vs Immigrants from Yemen Poverty
COMPARE
South African
Immigrants from Yemen
Poverty
Poverty Comparison
South Africans
Immigrants from Yemen
11.7%
POVERTY
87.0/ 100
METRIC RATING
129th/ 347
METRIC RANK
21.5%
POVERTY
0.0/ 100
METRIC RATING
342nd/ 347
METRIC RANK
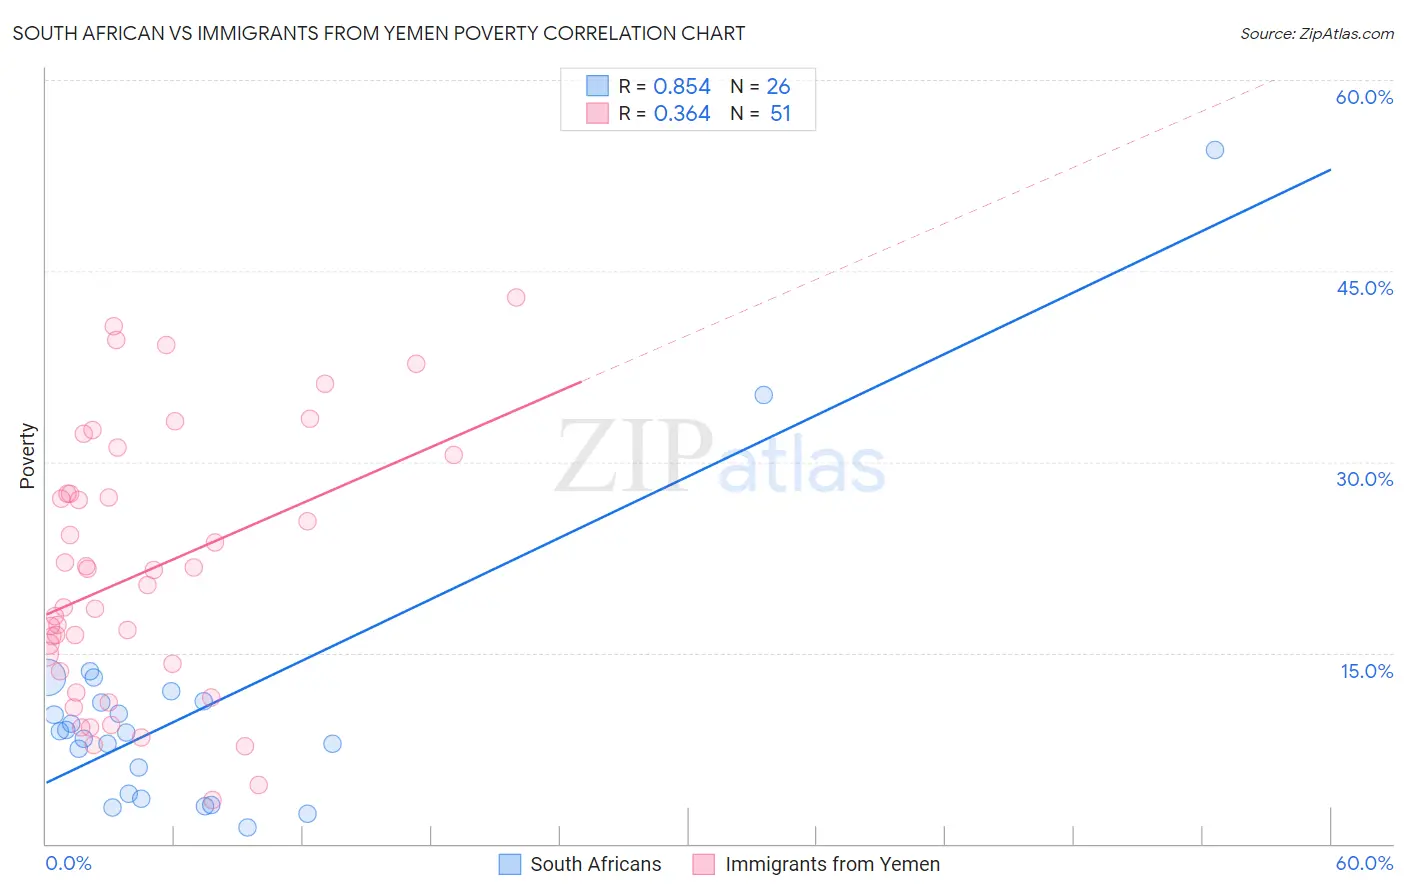
South African vs Immigrants from Yemen Poverty Correlation Chart
The statistical analysis conducted on geographies consisting of 182,558,592 people shows a very strong positive correlation between the proportion of South Africans and poverty level in the United States with a correlation coefficient (R) of 0.854 and weighted average of 11.7%. Similarly, the statistical analysis conducted on geographies consisting of 82,433,611 people shows a mild positive correlation between the proportion of Immigrants from Yemen and poverty level in the United States with a correlation coefficient (R) of 0.364 and weighted average of 21.5%, a difference of 83.1%.
Poverty Correlation Summary
| Measurement | South African | Immigrants from Yemen |
| Minimum | 1.3% | 3.5% |
| Maximum | 54.5% | 42.9% |
| Range | 53.2% | 39.4% |
| Mean | 10.7% | 21.3% |
| Median | 8.8% | 20.3% |
| Interquartile 25% (IQ1) | 3.9% | 13.6% |
| Interquartile 75% (IQ3) | 11.2% | 27.5% |
| Interquartile Range (IQR) | 7.2% | 13.9% |
| Standard Deviation (Sample) | 11.0% | 10.2% |
| Standard Deviation (Population) | 10.8% | 10.1% |
Similar Demographics by Poverty
Demographics Similar to South Africans by Poverty
In terms of poverty, the demographic groups most similar to South Africans are Immigrants from Israel (11.7%, a difference of 0.090%), Immigrants from Ukraine (11.8%, a difference of 0.090%), French (11.8%, a difference of 0.19%), Immigrants from Argentina (11.7%, a difference of 0.22%), and Immigrants from Norway (11.7%, a difference of 0.24%).
| Demographics | Rating | Rank | Poverty |
| Puget Sound Salish | 88.7 /100 | #122 | Excellent 11.7% |
| Immigrants | Hungary | 88.6 /100 | #123 | Excellent 11.7% |
| Soviet Union | 88.4 /100 | #124 | Excellent 11.7% |
| Immigrants | Brazil | 88.2 /100 | #125 | Excellent 11.7% |
| Immigrants | Norway | 88.0 /100 | #126 | Excellent 11.7% |
| Immigrants | Argentina | 88.0 /100 | #127 | Excellent 11.7% |
| Immigrants | Israel | 87.4 /100 | #128 | Excellent 11.7% |
| South Africans | 87.0 /100 | #129 | Excellent 11.7% |
| Immigrants | Ukraine | 86.6 /100 | #130 | Excellent 11.8% |
| French | 86.1 /100 | #131 | Excellent 11.8% |
| Peruvians | 85.6 /100 | #132 | Excellent 11.8% |
| Immigrants | Western Europe | 85.2 /100 | #133 | Excellent 11.8% |
| Yugoslavians | 85.2 /100 | #134 | Excellent 11.8% |
| Immigrants | Vietnam | 85.2 /100 | #135 | Excellent 11.8% |
| Chileans | 84.2 /100 | #136 | Excellent 11.8% |
Demographics Similar to Immigrants from Yemen by Poverty
In terms of poverty, the demographic groups most similar to Immigrants from Yemen are Pima (21.9%, a difference of 1.6%), Lumbee (21.9%, a difference of 1.9%), Hopi (20.8%, a difference of 3.2%), Yup'ik (20.8%, a difference of 3.4%), and Crow (20.7%, a difference of 4.1%).
| Demographics | Rating | Rank | Poverty |
| Houma | 0.0 /100 | #333 | Tragic 18.4% |
| Apache | 0.0 /100 | #334 | Tragic 18.4% |
| Cheyenne | 0.0 /100 | #335 | Tragic 18.9% |
| Pueblo | 0.0 /100 | #336 | Tragic 19.4% |
| Sioux | 0.0 /100 | #337 | Tragic 19.8% |
| Yuman | 0.0 /100 | #338 | Tragic 20.2% |
| Crow | 0.0 /100 | #339 | Tragic 20.7% |
| Yup'ik | 0.0 /100 | #340 | Tragic 20.8% |
| Hopi | 0.0 /100 | #341 | Tragic 20.8% |
| Immigrants | Yemen | 0.0 /100 | #342 | Tragic 21.5% |
| Pima | 0.0 /100 | #343 | Tragic 21.9% |
| Lumbee | 0.0 /100 | #344 | Tragic 21.9% |
| Navajo | 0.0 /100 | #345 | Tragic 23.1% |
| Puerto Ricans | 0.0 /100 | #346 | Tragic 23.7% |
| Tohono O'odham | 0.0 /100 | #347 | Tragic 24.4% |