Filipino vs Northern European Poverty
COMPARE
Filipino
Northern European
Poverty
Poverty Comparison
Filipinos
Northern Europeans
10.1%
POVERTY
99.9/ 100
METRIC RATING
7th/ 347
METRIC RANK
11.4%
POVERTY
96.0/ 100
METRIC RATING
87th/ 347
METRIC RANK
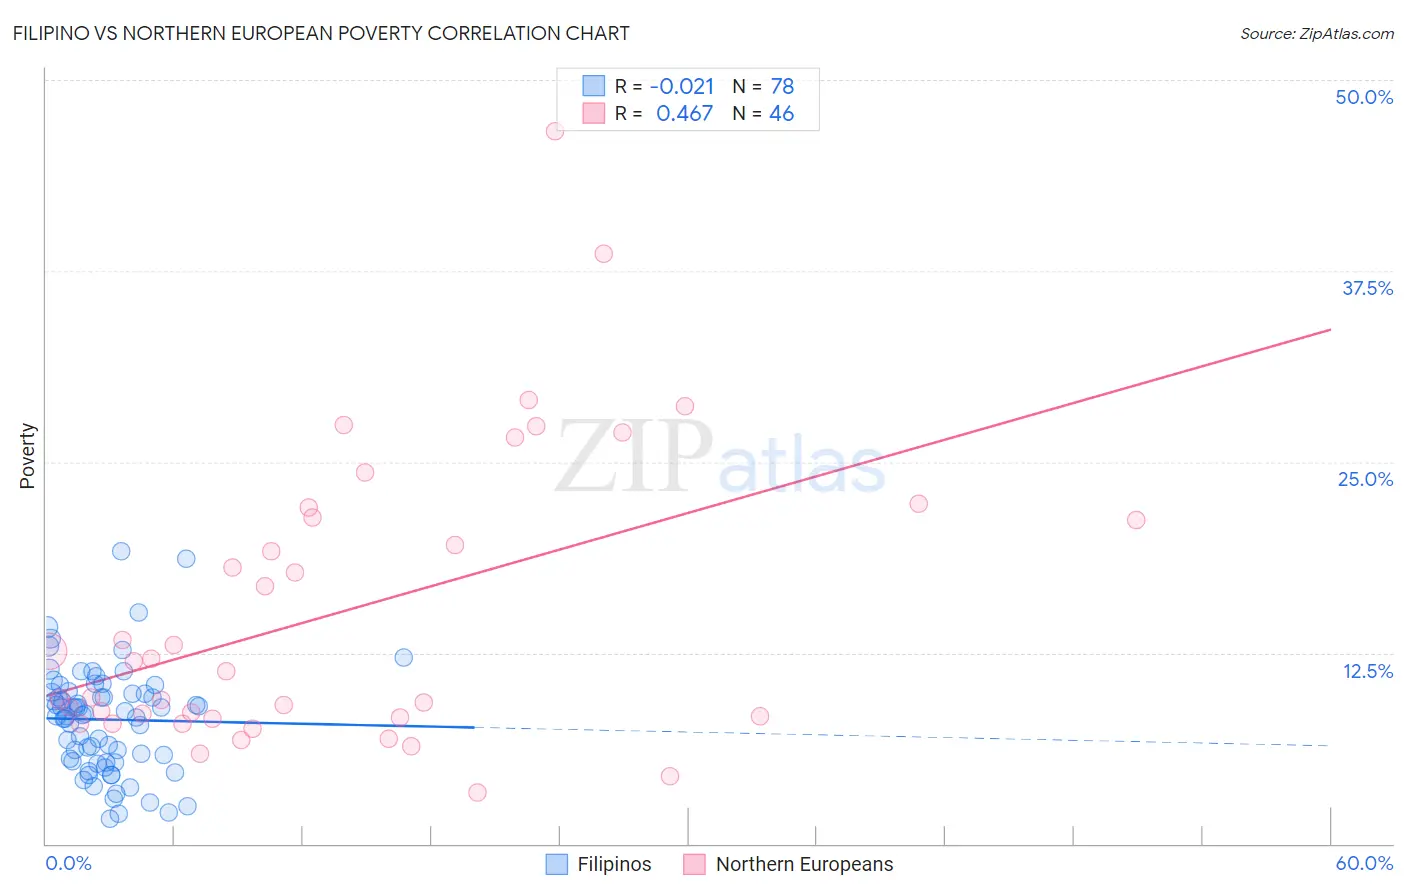
Filipino vs Northern European Poverty Correlation Chart
The statistical analysis conducted on geographies consisting of 254,160,394 people shows no correlation between the proportion of Filipinos and poverty level in the United States with a correlation coefficient (R) of -0.021 and weighted average of 10.1%. Similarly, the statistical analysis conducted on geographies consisting of 405,898,980 people shows a moderate positive correlation between the proportion of Northern Europeans and poverty level in the United States with a correlation coefficient (R) of 0.467 and weighted average of 11.4%, a difference of 12.4%.
Poverty Correlation Summary
| Measurement | Filipino | Northern European |
| Minimum | 1.6% | 3.3% |
| Maximum | 19.2% | 46.6% |
| Range | 17.6% | 43.3% |
| Mean | 8.1% | 15.2% |
| Median | 8.4% | 11.6% |
| Interquartile 25% (IQ1) | 5.4% | 8.3% |
| Interquartile 75% (IQ3) | 9.9% | 21.4% |
| Interquartile Range (IQR) | 4.5% | 13.1% |
| Standard Deviation (Sample) | 3.5% | 9.5% |
| Standard Deviation (Population) | 3.5% | 9.4% |
Similar Demographics by Poverty
Demographics Similar to Filipinos by Poverty
In terms of poverty, the demographic groups most similar to Filipinos are Assyrian/Chaldean/Syriac (10.1%, a difference of 0.14%), Immigrants from Ireland (10.1%, a difference of 0.32%), Maltese (10.2%, a difference of 0.42%), Immigrants from South Central Asia (10.2%, a difference of 0.87%), and Bulgarian (10.2%, a difference of 1.3%).
| Demographics | Rating | Rank | Poverty |
| Immigrants | India | 100.0 /100 | #1 | Exceptional 9.0% |
| Chinese | 100.0 /100 | #2 | Exceptional 9.5% |
| Thais | 100.0 /100 | #3 | Exceptional 9.6% |
| Immigrants | Taiwan | 100.0 /100 | #4 | Exceptional 9.7% |
| Immigrants | Ireland | 99.9 /100 | #5 | Exceptional 10.1% |
| Assyrians/Chaldeans/Syriacs | 99.9 /100 | #6 | Exceptional 10.1% |
| Filipinos | 99.9 /100 | #7 | Exceptional 10.1% |
| Maltese | 99.9 /100 | #8 | Exceptional 10.2% |
| Immigrants | South Central Asia | 99.9 /100 | #9 | Exceptional 10.2% |
| Bulgarians | 99.9 /100 | #10 | Exceptional 10.2% |
| Immigrants | Lithuania | 99.9 /100 | #11 | Exceptional 10.3% |
| Bhutanese | 99.8 /100 | #12 | Exceptional 10.4% |
| Immigrants | Hong Kong | 99.8 /100 | #13 | Exceptional 10.4% |
| Immigrants | Bolivia | 99.8 /100 | #14 | Exceptional 10.4% |
| Bolivians | 99.8 /100 | #15 | Exceptional 10.4% |
Demographics Similar to Northern Europeans by Poverty
In terms of poverty, the demographic groups most similar to Northern Europeans are Jordanian (11.4%, a difference of 0.0%), Immigrants from England (11.4%, a difference of 0.12%), Belgian (11.4%, a difference of 0.14%), Czechoslovakian (11.4%, a difference of 0.18%), and English (11.3%, a difference of 0.19%).
| Demographics | Rating | Rank | Poverty |
| Indians (Asian) | 96.6 /100 | #80 | Exceptional 11.3% |
| Irish | 96.6 /100 | #81 | Exceptional 11.3% |
| Egyptians | 96.5 /100 | #82 | Exceptional 11.3% |
| Immigrants | Sweden | 96.3 /100 | #83 | Exceptional 11.3% |
| English | 96.3 /100 | #84 | Exceptional 11.3% |
| Immigrants | England | 96.2 /100 | #85 | Exceptional 11.4% |
| Jordanians | 96.0 /100 | #86 | Exceptional 11.4% |
| Northern Europeans | 96.0 /100 | #87 | Exceptional 11.4% |
| Belgians | 95.8 /100 | #88 | Exceptional 11.4% |
| Czechoslovakians | 95.7 /100 | #89 | Exceptional 11.4% |
| Immigrants | Denmark | 95.5 /100 | #90 | Exceptional 11.4% |
| Finns | 95.2 /100 | #91 | Exceptional 11.4% |
| British | 95.0 /100 | #92 | Exceptional 11.4% |
| Romanians | 94.9 /100 | #93 | Exceptional 11.4% |
| Paraguayans | 94.9 /100 | #94 | Exceptional 11.4% |