Filipino vs Immigrants from Fiji Poverty
COMPARE
Filipino
Immigrants from Fiji
Poverty
Poverty Comparison
Filipinos
Immigrants from Fiji
10.1%
POVERTY
99.9/ 100
METRIC RATING
7th/ 347
METRIC RANK
12.2%
POVERTY
59.1/ 100
METRIC RATING
161st/ 347
METRIC RANK
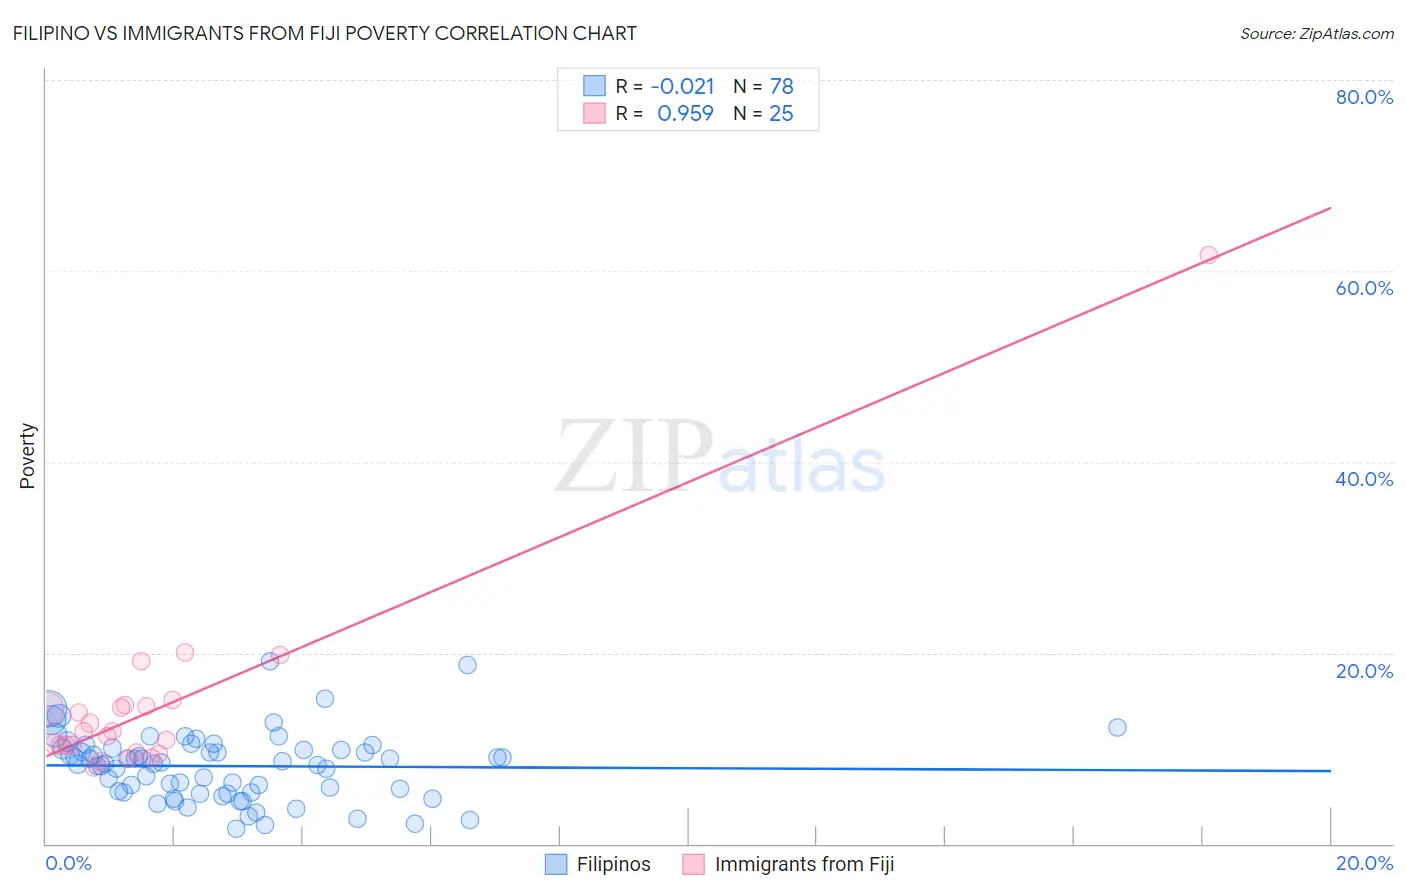
Filipino vs Immigrants from Fiji Poverty Correlation Chart
The statistical analysis conducted on geographies consisting of 254,160,394 people shows no correlation between the proportion of Filipinos and poverty level in the United States with a correlation coefficient (R) of -0.021 and weighted average of 10.1%. Similarly, the statistical analysis conducted on geographies consisting of 93,754,900 people shows a perfect positive correlation between the proportion of Immigrants from Fiji and poverty level in the United States with a correlation coefficient (R) of 0.959 and weighted average of 12.2%, a difference of 20.7%.
Poverty Correlation Summary
| Measurement | Filipino | Immigrants from Fiji |
| Minimum | 1.6% | 7.9% |
| Maximum | 19.2% | 61.7% |
| Range | 17.6% | 53.8% |
| Mean | 8.1% | 14.4% |
| Median | 8.4% | 11.8% |
| Interquartile 25% (IQ1) | 5.4% | 9.9% |
| Interquartile 75% (IQ3) | 9.9% | 14.5% |
| Interquartile Range (IQR) | 4.5% | 4.6% |
| Standard Deviation (Sample) | 3.5% | 10.4% |
| Standard Deviation (Population) | 3.5% | 10.2% |
Similar Demographics by Poverty
Demographics Similar to Filipinos by Poverty
In terms of poverty, the demographic groups most similar to Filipinos are Assyrian/Chaldean/Syriac (10.1%, a difference of 0.14%), Immigrants from Ireland (10.1%, a difference of 0.32%), Maltese (10.2%, a difference of 0.42%), Immigrants from South Central Asia (10.2%, a difference of 0.87%), and Bulgarian (10.2%, a difference of 1.3%).
| Demographics | Rating | Rank | Poverty |
| Immigrants | India | 100.0 /100 | #1 | Exceptional 9.0% |
| Chinese | 100.0 /100 | #2 | Exceptional 9.5% |
| Thais | 100.0 /100 | #3 | Exceptional 9.6% |
| Immigrants | Taiwan | 100.0 /100 | #4 | Exceptional 9.7% |
| Immigrants | Ireland | 99.9 /100 | #5 | Exceptional 10.1% |
| Assyrians/Chaldeans/Syriacs | 99.9 /100 | #6 | Exceptional 10.1% |
| Filipinos | 99.9 /100 | #7 | Exceptional 10.1% |
| Maltese | 99.9 /100 | #8 | Exceptional 10.2% |
| Immigrants | South Central Asia | 99.9 /100 | #9 | Exceptional 10.2% |
| Bulgarians | 99.9 /100 | #10 | Exceptional 10.2% |
| Immigrants | Lithuania | 99.9 /100 | #11 | Exceptional 10.3% |
| Bhutanese | 99.8 /100 | #12 | Exceptional 10.4% |
| Immigrants | Hong Kong | 99.8 /100 | #13 | Exceptional 10.4% |
| Immigrants | Bolivia | 99.8 /100 | #14 | Exceptional 10.4% |
| Bolivians | 99.8 /100 | #15 | Exceptional 10.4% |
Demographics Similar to Immigrants from Fiji by Poverty
In terms of poverty, the demographic groups most similar to Immigrants from Fiji are Ethiopian (12.2%, a difference of 0.010%), Immigrants from Ethiopia (12.2%, a difference of 0.060%), Immigrants from Nepal (12.2%, a difference of 0.13%), Colombian (12.2%, a difference of 0.13%), and Immigrants from Albania (12.2%, a difference of 0.14%).
| Demographics | Rating | Rank | Poverty |
| Guamanians/Chamorros | 63.9 /100 | #154 | Good 12.1% |
| Hungarians | 63.6 /100 | #155 | Good 12.2% |
| Scotch-Irish | 62.6 /100 | #156 | Good 12.2% |
| Costa Ricans | 62.2 /100 | #157 | Good 12.2% |
| Taiwanese | 61.8 /100 | #158 | Good 12.2% |
| Pennsylvania Germans | 60.8 /100 | #159 | Good 12.2% |
| Immigrants | Nepal | 60.4 /100 | #160 | Good 12.2% |
| Immigrants | Fiji | 59.1 /100 | #161 | Average 12.2% |
| Ethiopians | 59.1 /100 | #162 | Average 12.2% |
| Immigrants | Ethiopia | 58.6 /100 | #163 | Average 12.2% |
| Colombians | 57.8 /100 | #164 | Average 12.2% |
| Immigrants | Albania | 57.7 /100 | #165 | Average 12.2% |
| Venezuelans | 56.9 /100 | #166 | Average 12.2% |
| Immigrants | Chile | 56.7 /100 | #167 | Average 12.2% |
| Immigrants | Venezuela | 56.5 /100 | #168 | Average 12.2% |