Houma vs Immigrants from Fiji Poverty
COMPARE
Houma
Immigrants from Fiji
Poverty
Poverty Comparison
Houma
Immigrants from Fiji
18.4%
POVERTY
0.0/ 100
METRIC RATING
333rd/ 347
METRIC RANK
12.2%
POVERTY
59.1/ 100
METRIC RATING
161st/ 347
METRIC RANK
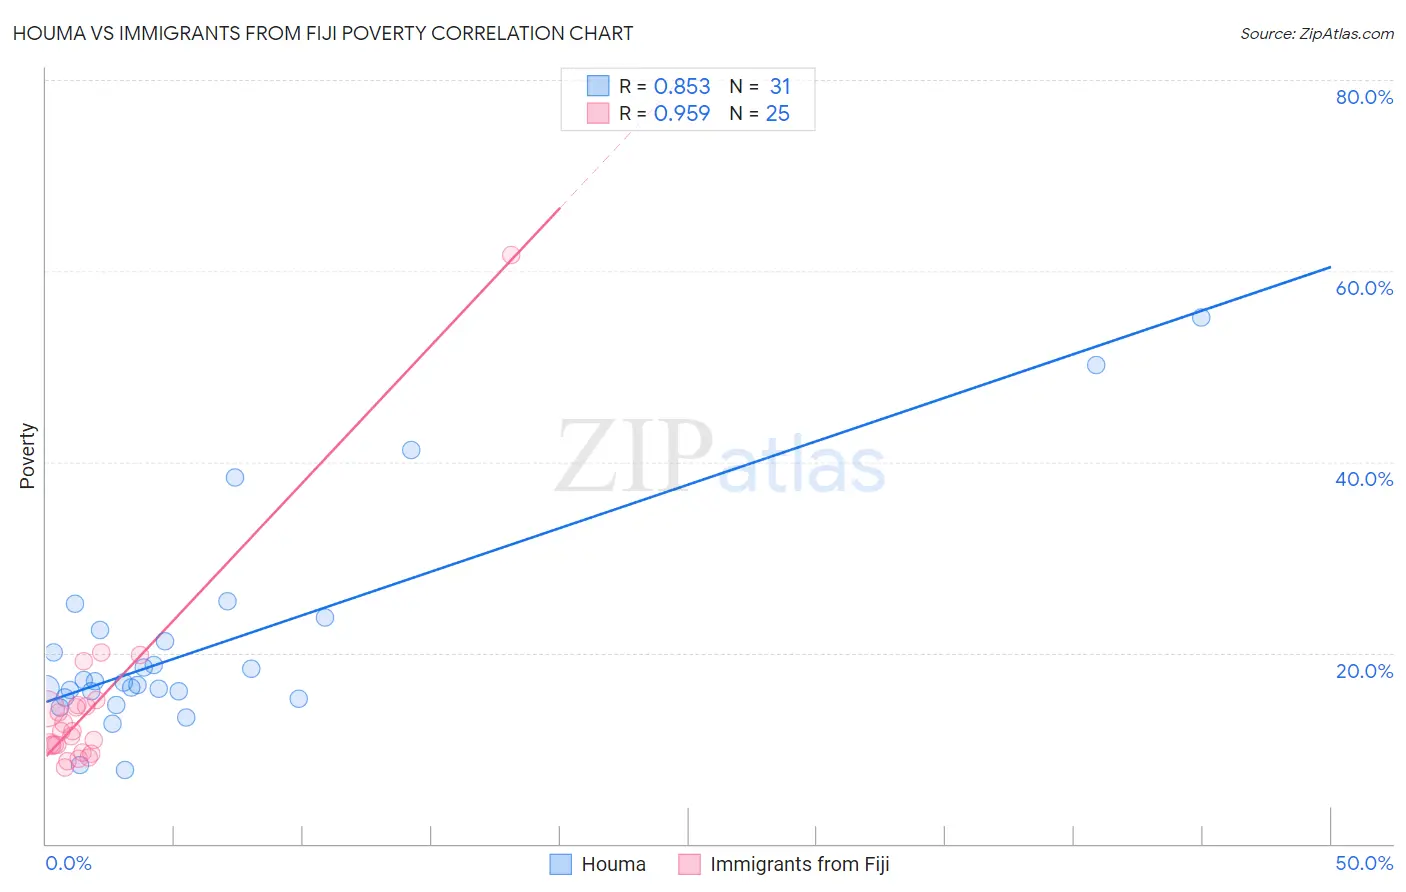
Houma vs Immigrants from Fiji Poverty Correlation Chart
The statistical analysis conducted on geographies consisting of 36,796,778 people shows a very strong positive correlation between the proportion of Houma and poverty level in the United States with a correlation coefficient (R) of 0.853 and weighted average of 18.4%. Similarly, the statistical analysis conducted on geographies consisting of 93,754,900 people shows a perfect positive correlation between the proportion of Immigrants from Fiji and poverty level in the United States with a correlation coefficient (R) of 0.959 and weighted average of 12.2%, a difference of 50.9%.
Poverty Correlation Summary
| Measurement | Houma | Immigrants from Fiji |
| Minimum | 7.7% | 7.9% |
| Maximum | 55.1% | 61.7% |
| Range | 47.4% | 53.8% |
| Mean | 20.8% | 14.4% |
| Median | 16.9% | 11.8% |
| Interquartile 25% (IQ1) | 15.3% | 9.9% |
| Interquartile 75% (IQ3) | 22.4% | 14.5% |
| Interquartile Range (IQR) | 7.1% | 4.6% |
| Standard Deviation (Sample) | 11.0% | 10.4% |
| Standard Deviation (Population) | 10.8% | 10.2% |
Similar Demographics by Poverty
Demographics Similar to Houma by Poverty
In terms of poverty, the demographic groups most similar to Houma are Apache (18.4%, a difference of 0.0%), Native/Alaskan (18.1%, a difference of 2.0%), Cheyenne (18.9%, a difference of 2.8%), Immigrants from Dominican Republic (17.8%, a difference of 3.5%), and Dominican (17.6%, a difference of 4.4%).
| Demographics | Rating | Rank | Poverty |
| Paiute | 0.0 /100 | #326 | Tragic 16.7% |
| Kiowa | 0.0 /100 | #327 | Tragic 16.8% |
| Ute | 0.0 /100 | #328 | Tragic 16.9% |
| Blacks/African Americans | 0.0 /100 | #329 | Tragic 17.3% |
| Dominicans | 0.0 /100 | #330 | Tragic 17.6% |
| Immigrants | Dominican Republic | 0.0 /100 | #331 | Tragic 17.8% |
| Natives/Alaskans | 0.0 /100 | #332 | Tragic 18.1% |
| Houma | 0.0 /100 | #333 | Tragic 18.4% |
| Apache | 0.0 /100 | #334 | Tragic 18.4% |
| Cheyenne | 0.0 /100 | #335 | Tragic 18.9% |
| Pueblo | 0.0 /100 | #336 | Tragic 19.4% |
| Sioux | 0.0 /100 | #337 | Tragic 19.8% |
| Yuman | 0.0 /100 | #338 | Tragic 20.2% |
| Crow | 0.0 /100 | #339 | Tragic 20.7% |
| Yup'ik | 0.0 /100 | #340 | Tragic 20.8% |
Demographics Similar to Immigrants from Fiji by Poverty
In terms of poverty, the demographic groups most similar to Immigrants from Fiji are Ethiopian (12.2%, a difference of 0.010%), Immigrants from Ethiopia (12.2%, a difference of 0.060%), Immigrants from Nepal (12.2%, a difference of 0.13%), Colombian (12.2%, a difference of 0.13%), and Immigrants from Albania (12.2%, a difference of 0.14%).
| Demographics | Rating | Rank | Poverty |
| Guamanians/Chamorros | 63.9 /100 | #154 | Good 12.1% |
| Hungarians | 63.6 /100 | #155 | Good 12.2% |
| Scotch-Irish | 62.6 /100 | #156 | Good 12.2% |
| Costa Ricans | 62.2 /100 | #157 | Good 12.2% |
| Taiwanese | 61.8 /100 | #158 | Good 12.2% |
| Pennsylvania Germans | 60.8 /100 | #159 | Good 12.2% |
| Immigrants | Nepal | 60.4 /100 | #160 | Good 12.2% |
| Immigrants | Fiji | 59.1 /100 | #161 | Average 12.2% |
| Ethiopians | 59.1 /100 | #162 | Average 12.2% |
| Immigrants | Ethiopia | 58.6 /100 | #163 | Average 12.2% |
| Colombians | 57.8 /100 | #164 | Average 12.2% |
| Immigrants | Albania | 57.7 /100 | #165 | Average 12.2% |
| Venezuelans | 56.9 /100 | #166 | Average 12.2% |
| Immigrants | Chile | 56.7 /100 | #167 | Average 12.2% |
| Immigrants | Venezuela | 56.5 /100 | #168 | Average 12.2% |