Filipino vs Immigrants from Fiji Average Family Size
COMPARE
Filipino
Immigrants from Fiji
Average Family Size
Average Family Size Comparison
Filipinos
Immigrants from Fiji
3.20
AVERAGE FAMILY SIZE
13.6/ 100
METRIC RATING
207th/ 347
METRIC RANK
3.45
AVERAGE FAMILY SIZE
100.0/ 100
METRIC RATING
23rd/ 347
METRIC RANK
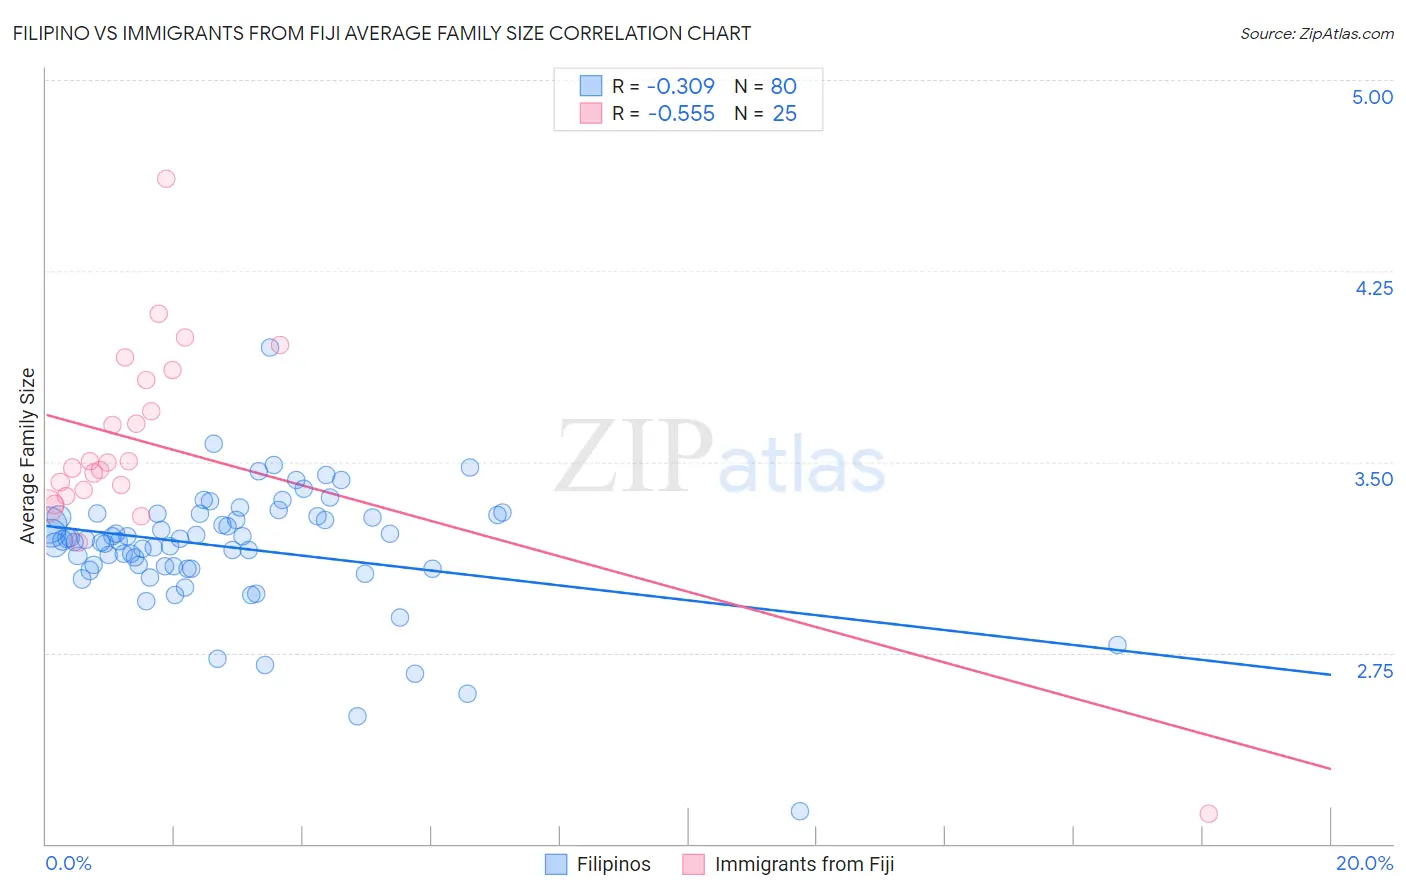
Filipino vs Immigrants from Fiji Average Family Size Correlation Chart
The statistical analysis conducted on geographies consisting of 254,177,261 people shows a mild negative correlation between the proportion of Filipinos and average family size in the United States with a correlation coefficient (R) of -0.309 and weighted average of 3.20. Similarly, the statistical analysis conducted on geographies consisting of 93,754,900 people shows a substantial negative correlation between the proportion of Immigrants from Fiji and average family size in the United States with a correlation coefficient (R) of -0.555 and weighted average of 3.45, a difference of 7.9%.
Average Family Size Correlation Summary
| Measurement | Filipino | Immigrants from Fiji |
| Minimum | 2.13 | 2.12 |
| Maximum | 3.95 | 4.61 |
| Range | 1.82 | 2.49 |
| Mean | 3.16 | 3.56 |
| Median | 3.19 | 3.50 |
| Interquartile 25% (IQ1) | 3.09 | 3.38 |
| Interquartile 75% (IQ3) | 3.29 | 3.84 |
| Interquartile Range (IQR) | 0.20 | 0.46 |
| Standard Deviation (Sample) | 0.24 | 0.44 |
| Standard Deviation (Population) | 0.24 | 0.43 |
Similar Demographics by Average Family Size
Demographics Similar to Filipinos by Average Family Size
In terms of average family size, the demographic groups most similar to Filipinos are Chippewa (3.20, a difference of 0.010%), Sudanese (3.20, a difference of 0.010%), Zimbabwean (3.20, a difference of 0.040%), Immigrants from Iran (3.20, a difference of 0.060%), and Creek (3.20, a difference of 0.060%).
| Demographics | Rating | Rank | Average Family Size |
| Immigrants | Kenya | 19.2 /100 | #200 | Poor 3.21 |
| Immigrants | Morocco | 18.5 /100 | #201 | Poor 3.21 |
| Immigrants | India | 18.5 /100 | #202 | Poor 3.21 |
| Immigrants | Nepal | 18.1 /100 | #203 | Poor 3.21 |
| Immigrants | Poland | 16.6 /100 | #204 | Poor 3.20 |
| Paraguayans | 16.3 /100 | #205 | Poor 3.20 |
| Immigrants | Cabo Verde | 16.0 /100 | #206 | Poor 3.20 |
| Filipinos | 13.6 /100 | #207 | Poor 3.20 |
| Chippewa | 13.3 /100 | #208 | Poor 3.20 |
| Sudanese | 13.3 /100 | #209 | Poor 3.20 |
| Zimbabweans | 12.6 /100 | #210 | Poor 3.20 |
| Immigrants | Iran | 12.1 /100 | #211 | Poor 3.20 |
| Creek | 12.1 /100 | #212 | Poor 3.20 |
| Mongolians | 11.5 /100 | #213 | Poor 3.20 |
| Somalis | 11.2 /100 | #214 | Poor 3.20 |
Demographics Similar to Immigrants from Fiji by Average Family Size
In terms of average family size, the demographic groups most similar to Immigrants from Fiji are Native/Alaskan (3.45, a difference of 0.12%), Yakama (3.45, a difference of 0.23%), Apache (3.46, a difference of 0.29%), Yuman (3.47, a difference of 0.35%), and Cheyenne (3.47, a difference of 0.60%).
| Demographics | Rating | Rank | Average Family Size |
| Ute | 100.0 /100 | #16 | Exceptional 3.49 |
| Immigrants | El Salvador | 100.0 /100 | #17 | Exceptional 3.49 |
| Salvadorans | 100.0 /100 | #18 | Exceptional 3.48 |
| Mexicans | 100.0 /100 | #19 | Exceptional 3.48 |
| Cheyenne | 100.0 /100 | #20 | Exceptional 3.47 |
| Yuman | 100.0 /100 | #21 | Exceptional 3.47 |
| Apache | 100.0 /100 | #22 | Exceptional 3.46 |
| Immigrants | Fiji | 100.0 /100 | #23 | Exceptional 3.45 |
| Natives/Alaskans | 100.0 /100 | #24 | Exceptional 3.45 |
| Yakama | 100.0 /100 | #25 | Exceptional 3.45 |
| Native Hawaiians | 100.0 /100 | #26 | Exceptional 3.43 |
| Mexican American Indians | 100.0 /100 | #27 | Exceptional 3.43 |
| Immigrants | Latin America | 100.0 /100 | #28 | Exceptional 3.42 |
| Nepalese | 100.0 /100 | #29 | Exceptional 3.42 |
| Samoans | 100.0 /100 | #30 | Exceptional 3.42 |