Filipino vs Immigrants from Fiji Householder Income Ages 45 - 64 years
COMPARE
Filipino
Immigrants from Fiji
Householder Income Ages 45 - 64 years
Householder Income Ages 45 - 64 years Comparison
Filipinos
Immigrants from Fiji
$134,910
HOUSEHOLDER INCOME AGES 45 - 64 YEARS
100.0/ 100
METRIC RATING
2nd/ 347
METRIC RANK
$106,952
HOUSEHOLDER INCOME AGES 45 - 64 YEARS
96.5/ 100
METRIC RATING
107th/ 347
METRIC RANK
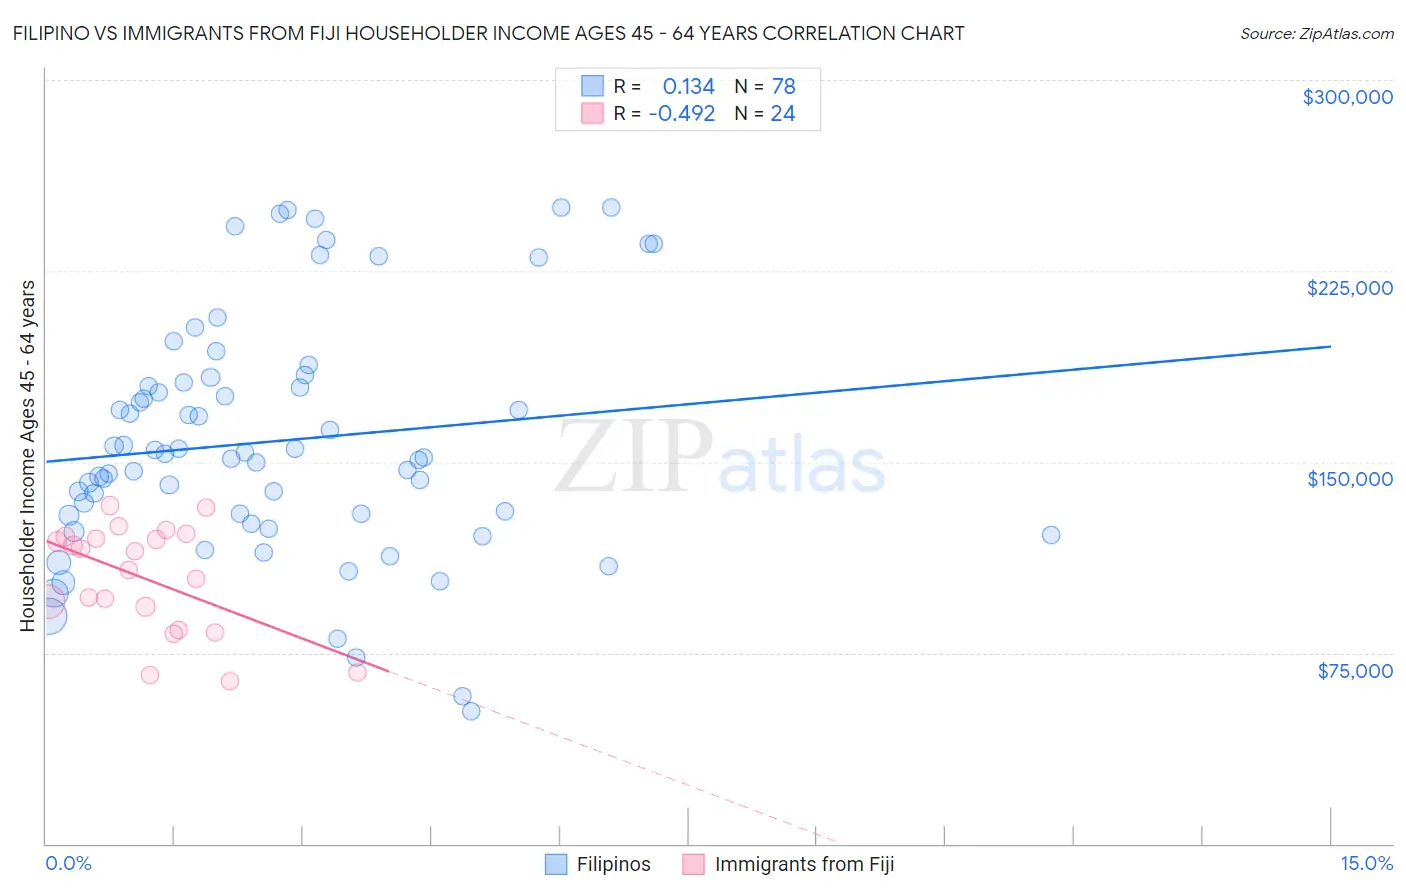
Filipino vs Immigrants from Fiji Householder Income Ages 45 - 64 years Correlation Chart
The statistical analysis conducted on geographies consisting of 254,006,751 people shows a poor positive correlation between the proportion of Filipinos and household income with householder between the ages 45 and 64 in the United States with a correlation coefficient (R) of 0.134 and weighted average of $134,910. Similarly, the statistical analysis conducted on geographies consisting of 93,744,178 people shows a moderate negative correlation between the proportion of Immigrants from Fiji and household income with householder between the ages 45 and 64 in the United States with a correlation coefficient (R) of -0.492 and weighted average of $106,952, a difference of 26.1%.
Householder Income Ages 45 - 64 years Correlation Summary
| Measurement | Filipino | Immigrants from Fiji |
| Minimum | $51,856 | $63,895 |
| Maximum | $250,001 | $132,819 |
| Range | $198,145 | $68,924 |
| Mean | $158,185 | $104,214 |
| Median | $152,545 | $111,173 |
| Interquartile 25% (IQ1) | $128,904 | $88,582 |
| Interquartile 75% (IQ3) | $181,123 | $120,299 |
| Interquartile Range (IQR) | $52,219 | $31,717 |
| Standard Deviation (Sample) | $46,977 | $21,039 |
| Standard Deviation (Population) | $46,675 | $20,596 |
Similar Demographics by Householder Income Ages 45 - 64 years
Demographics Similar to Filipinos by Householder Income Ages 45 - 64 years
In terms of householder income ages 45 - 64 years, the demographic groups most similar to Filipinos are Immigrants from Taiwan ($135,508, a difference of 0.44%), Immigrants from India ($132,488, a difference of 1.8%), Thai ($129,560, a difference of 4.1%), Immigrants from Singapore ($129,514, a difference of 4.2%), and Iranian ($129,350, a difference of 4.3%).
| Demographics | Rating | Rank | Householder Income Ages 45 - 64 years |
| Immigrants | Taiwan | 100.0 /100 | #1 | Exceptional $135,508 |
| Filipinos | 100.0 /100 | #2 | Exceptional $134,910 |
| Immigrants | India | 100.0 /100 | #3 | Exceptional $132,488 |
| Thais | 100.0 /100 | #4 | Exceptional $129,560 |
| Immigrants | Singapore | 100.0 /100 | #5 | Exceptional $129,514 |
| Iranians | 100.0 /100 | #6 | Exceptional $129,350 |
| Immigrants | Hong Kong | 100.0 /100 | #7 | Exceptional $127,500 |
| Immigrants | Iran | 100.0 /100 | #8 | Exceptional $126,940 |
| Okinawans | 100.0 /100 | #9 | Exceptional $124,796 |
| Immigrants | South Central Asia | 100.0 /100 | #10 | Exceptional $124,188 |
| Cypriots | 100.0 /100 | #11 | Exceptional $123,396 |
| Immigrants | Israel | 100.0 /100 | #12 | Exceptional $122,893 |
| Immigrants | Ireland | 100.0 /100 | #13 | Exceptional $122,757 |
| Indians (Asian) | 100.0 /100 | #14 | Exceptional $122,343 |
| Immigrants | Eastern Asia | 100.0 /100 | #15 | Exceptional $122,222 |
Demographics Similar to Immigrants from Fiji by Householder Income Ages 45 - 64 years
In terms of householder income ages 45 - 64 years, the demographic groups most similar to Immigrants from Fiji are Armenian ($107,002, a difference of 0.050%), Zimbabwean ($106,849, a difference of 0.10%), Macedonian ($107,074, a difference of 0.11%), Immigrants from Ukraine ($107,079, a difference of 0.12%), and Syrian ($107,207, a difference of 0.24%).
| Demographics | Rating | Rank | Householder Income Ages 45 - 64 years |
| Immigrants | Serbia | 97.4 /100 | #100 | Exceptional $107,569 |
| Immigrants | Kazakhstan | 97.2 /100 | #101 | Exceptional $107,378 |
| Immigrants | Moldova | 97.1 /100 | #102 | Exceptional $107,357 |
| Syrians | 96.9 /100 | #103 | Exceptional $107,207 |
| Immigrants | Ukraine | 96.7 /100 | #104 | Exceptional $107,079 |
| Macedonians | 96.7 /100 | #105 | Exceptional $107,074 |
| Armenians | 96.6 /100 | #106 | Exceptional $107,002 |
| Immigrants | Fiji | 96.5 /100 | #107 | Exceptional $106,952 |
| Zimbabweans | 96.3 /100 | #108 | Exceptional $106,849 |
| Chileans | 95.9 /100 | #109 | Exceptional $106,611 |
| Immigrants | Brazil | 95.6 /100 | #110 | Exceptional $106,470 |
| Immigrants | Vietnam | 95.5 /100 | #111 | Exceptional $106,417 |
| Swedes | 95.4 /100 | #112 | Exceptional $106,377 |
| Europeans | 95.4 /100 | #113 | Exceptional $106,367 |
| Immigrants | Poland | 95.3 /100 | #114 | Exceptional $106,319 |