Fijian vs Immigrants from Fiji Poverty
COMPARE
Fijian
Immigrants from Fiji
Poverty
Poverty Comparison
Fijians
Immigrants from Fiji
13.7%
POVERTY
0.8/ 100
METRIC RATING
232nd/ 347
METRIC RANK
12.2%
POVERTY
59.1/ 100
METRIC RATING
161st/ 347
METRIC RANK
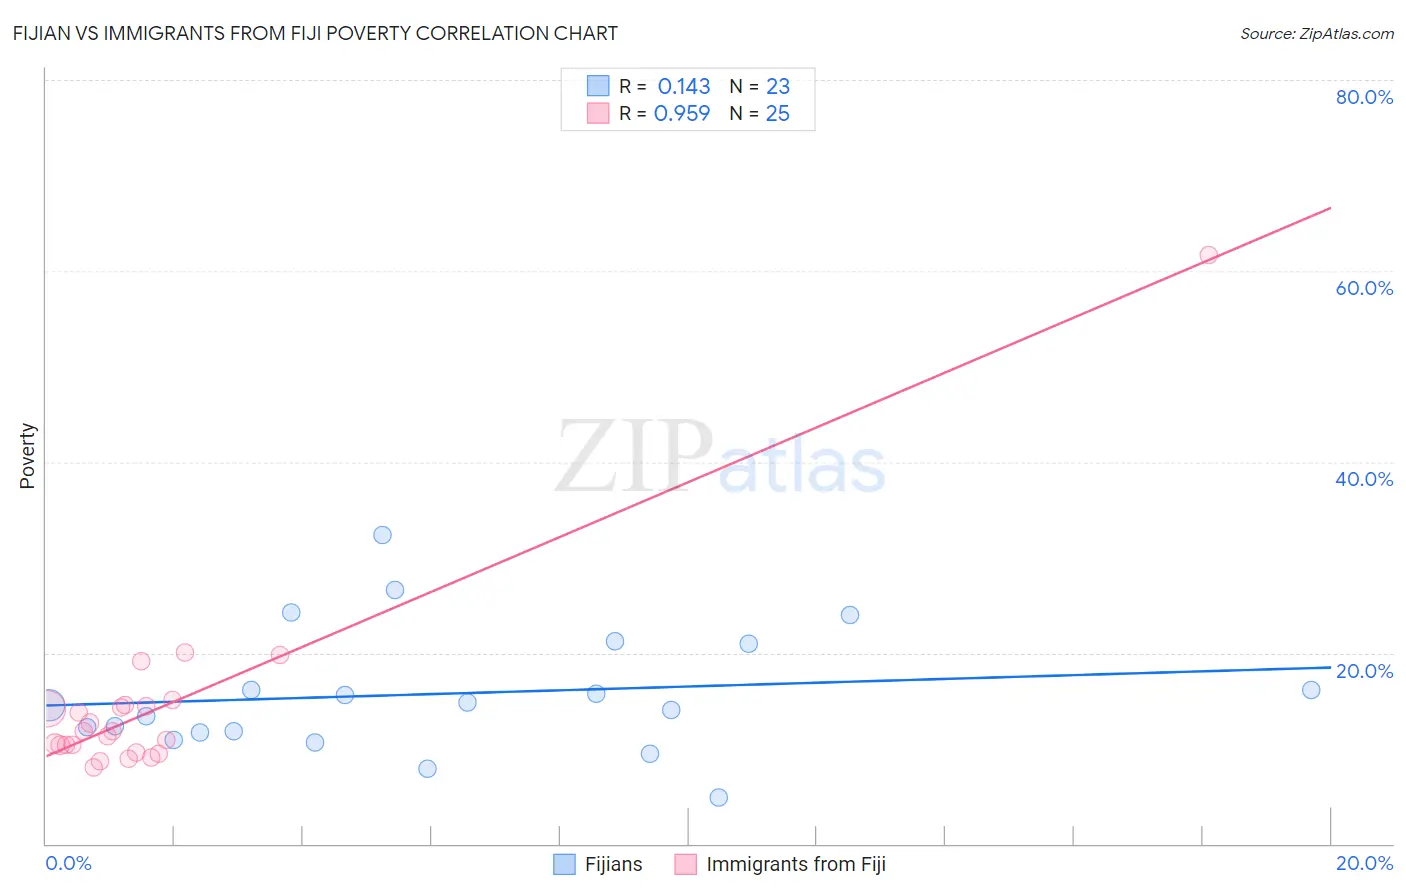
Fijian vs Immigrants from Fiji Poverty Correlation Chart
The statistical analysis conducted on geographies consisting of 55,947,896 people shows a poor positive correlation between the proportion of Fijians and poverty level in the United States with a correlation coefficient (R) of 0.143 and weighted average of 13.7%. Similarly, the statistical analysis conducted on geographies consisting of 93,754,900 people shows a perfect positive correlation between the proportion of Immigrants from Fiji and poverty level in the United States with a correlation coefficient (R) of 0.959 and weighted average of 12.2%, a difference of 12.5%.
Poverty Correlation Summary
| Measurement | Fijian | Immigrants from Fiji |
| Minimum | 4.9% | 7.9% |
| Maximum | 32.3% | 61.7% |
| Range | 27.5% | 53.8% |
| Mean | 15.7% | 14.4% |
| Median | 14.5% | 11.8% |
| Interquartile 25% (IQ1) | 11.7% | 9.9% |
| Interquartile 75% (IQ3) | 21.0% | 14.5% |
| Interquartile Range (IQR) | 9.3% | 4.6% |
| Standard Deviation (Sample) | 6.5% | 10.4% |
| Standard Deviation (Population) | 6.3% | 10.2% |
Similar Demographics by Poverty
Demographics Similar to Fijians by Poverty
In terms of poverty, the demographic groups most similar to Fijians are Immigrants from Saudi Arabia (13.8%, a difference of 0.25%), Immigrants from Laos (13.8%, a difference of 0.49%), Cuban (13.9%, a difference of 0.93%), Immigrants from Armenia (13.9%, a difference of 0.96%), and French American Indian (13.9%, a difference of 0.98%).
| Demographics | Rating | Rank | Poverty |
| German Russians | 2.2 /100 | #225 | Tragic 13.4% |
| Marshallese | 2.2 /100 | #226 | Tragic 13.4% |
| Alaska Natives | 2.1 /100 | #227 | Tragic 13.5% |
| Immigrants | Nigeria | 1.7 /100 | #228 | Tragic 13.5% |
| Osage | 1.5 /100 | #229 | Tragic 13.6% |
| Alaskan Athabascans | 1.5 /100 | #230 | Tragic 13.6% |
| Nigerians | 1.4 /100 | #231 | Tragic 13.6% |
| Fijians | 0.8 /100 | #232 | Tragic 13.7% |
| Immigrants | Saudi Arabia | 0.8 /100 | #233 | Tragic 13.8% |
| Immigrants | Laos | 0.7 /100 | #234 | Tragic 13.8% |
| Cubans | 0.6 /100 | #235 | Tragic 13.9% |
| Immigrants | Armenia | 0.5 /100 | #236 | Tragic 13.9% |
| French American Indians | 0.5 /100 | #237 | Tragic 13.9% |
| Ghanaians | 0.5 /100 | #238 | Tragic 13.9% |
| Nicaraguans | 0.4 /100 | #239 | Tragic 13.9% |
Demographics Similar to Immigrants from Fiji by Poverty
In terms of poverty, the demographic groups most similar to Immigrants from Fiji are Ethiopian (12.2%, a difference of 0.010%), Immigrants from Ethiopia (12.2%, a difference of 0.060%), Immigrants from Nepal (12.2%, a difference of 0.13%), Colombian (12.2%, a difference of 0.13%), and Immigrants from Albania (12.2%, a difference of 0.14%).
| Demographics | Rating | Rank | Poverty |
| Guamanians/Chamorros | 63.9 /100 | #154 | Good 12.1% |
| Hungarians | 63.6 /100 | #155 | Good 12.2% |
| Scotch-Irish | 62.6 /100 | #156 | Good 12.2% |
| Costa Ricans | 62.2 /100 | #157 | Good 12.2% |
| Taiwanese | 61.8 /100 | #158 | Good 12.2% |
| Pennsylvania Germans | 60.8 /100 | #159 | Good 12.2% |
| Immigrants | Nepal | 60.4 /100 | #160 | Good 12.2% |
| Immigrants | Fiji | 59.1 /100 | #161 | Average 12.2% |
| Ethiopians | 59.1 /100 | #162 | Average 12.2% |
| Immigrants | Ethiopia | 58.6 /100 | #163 | Average 12.2% |
| Colombians | 57.8 /100 | #164 | Average 12.2% |
| Immigrants | Albania | 57.7 /100 | #165 | Average 12.2% |
| Venezuelans | 56.9 /100 | #166 | Average 12.2% |
| Immigrants | Chile | 56.7 /100 | #167 | Average 12.2% |
| Immigrants | Venezuela | 56.5 /100 | #168 | Average 12.2% |