Welsh vs Immigrants from Fiji Poverty
COMPARE
Welsh
Immigrants from Fiji
Poverty
Poverty Comparison
Welsh
Immigrants from Fiji
11.6%
POVERTY
91.6/ 100
METRIC RATING
110th/ 347
METRIC RANK
12.2%
POVERTY
59.1/ 100
METRIC RATING
161st/ 347
METRIC RANK
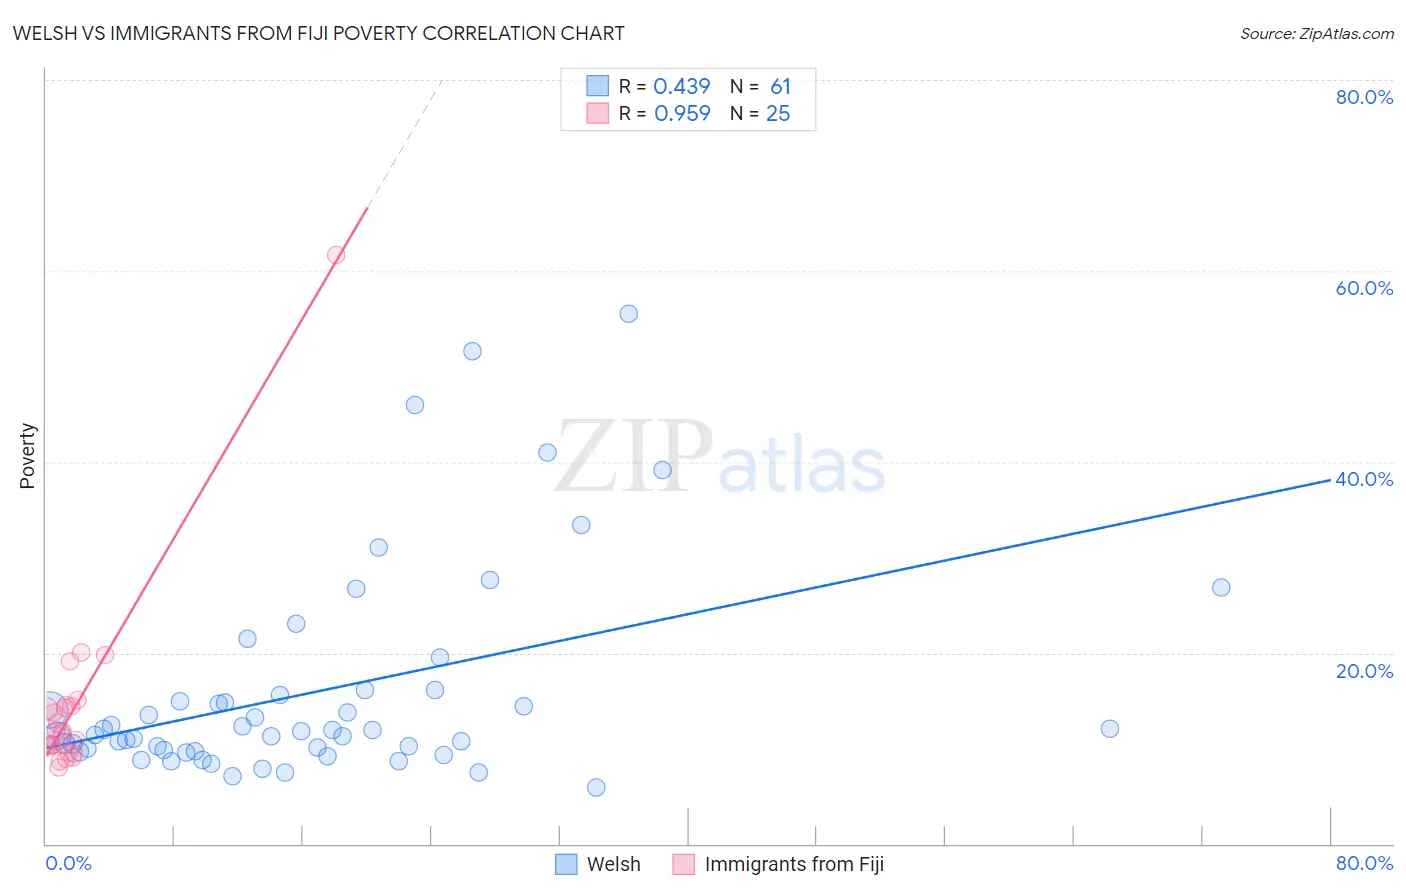
Welsh vs Immigrants from Fiji Poverty Correlation Chart
The statistical analysis conducted on geographies consisting of 528,094,274 people shows a moderate positive correlation between the proportion of Welsh and poverty level in the United States with a correlation coefficient (R) of 0.439 and weighted average of 11.6%. Similarly, the statistical analysis conducted on geographies consisting of 93,754,900 people shows a perfect positive correlation between the proportion of Immigrants from Fiji and poverty level in the United States with a correlation coefficient (R) of 0.959 and weighted average of 12.2%, a difference of 5.2%.
Poverty Correlation Summary
| Measurement | Welsh | Immigrants from Fiji |
| Minimum | 5.9% | 7.9% |
| Maximum | 55.5% | 61.7% |
| Range | 49.6% | 53.8% |
| Mean | 16.0% | 14.4% |
| Median | 11.8% | 11.8% |
| Interquartile 25% (IQ1) | 9.8% | 9.9% |
| Interquartile 75% (IQ3) | 15.8% | 14.5% |
| Interquartile Range (IQR) | 6.0% | 4.6% |
| Standard Deviation (Sample) | 11.0% | 10.4% |
| Standard Deviation (Population) | 11.0% | 10.2% |
Similar Demographics by Poverty
Demographics Similar to Welsh by Poverty
In terms of poverty, the demographic groups most similar to Welsh are Immigrants from Turkey (11.6%, a difference of 0.040%), Canadian (11.6%, a difference of 0.060%), Palestinian (11.6%, a difference of 0.090%), French Canadian (11.6%, a difference of 0.17%), and Portuguese (11.6%, a difference of 0.18%).
| Demographics | Rating | Rank | Poverty |
| Okinawans | 92.4 /100 | #103 | Exceptional 11.6% |
| Native Hawaiians | 92.1 /100 | #104 | Exceptional 11.6% |
| Portuguese | 92.1 /100 | #105 | Exceptional 11.6% |
| Immigrants | Zimbabwe | 92.1 /100 | #106 | Exceptional 11.6% |
| Palestinians | 91.8 /100 | #107 | Exceptional 11.6% |
| Canadians | 91.7 /100 | #108 | Exceptional 11.6% |
| Immigrants | Turkey | 91.7 /100 | #109 | Exceptional 11.6% |
| Welsh | 91.6 /100 | #110 | Exceptional 11.6% |
| French Canadians | 91.0 /100 | #111 | Exceptional 11.6% |
| Immigrants | Southern Europe | 90.8 /100 | #112 | Exceptional 11.6% |
| Immigrants | Belarus | 90.8 /100 | #113 | Exceptional 11.6% |
| Immigrants | China | 90.7 /100 | #114 | Exceptional 11.6% |
| Albanians | 90.3 /100 | #115 | Exceptional 11.7% |
| Immigrants | Russia | 89.7 /100 | #116 | Excellent 11.7% |
| Sri Lankans | 89.4 /100 | #117 | Excellent 11.7% |
Demographics Similar to Immigrants from Fiji by Poverty
In terms of poverty, the demographic groups most similar to Immigrants from Fiji are Ethiopian (12.2%, a difference of 0.010%), Immigrants from Ethiopia (12.2%, a difference of 0.060%), Immigrants from Nepal (12.2%, a difference of 0.13%), Colombian (12.2%, a difference of 0.13%), and Immigrants from Albania (12.2%, a difference of 0.14%).
| Demographics | Rating | Rank | Poverty |
| Guamanians/Chamorros | 63.9 /100 | #154 | Good 12.1% |
| Hungarians | 63.6 /100 | #155 | Good 12.2% |
| Scotch-Irish | 62.6 /100 | #156 | Good 12.2% |
| Costa Ricans | 62.2 /100 | #157 | Good 12.2% |
| Taiwanese | 61.8 /100 | #158 | Good 12.2% |
| Pennsylvania Germans | 60.8 /100 | #159 | Good 12.2% |
| Immigrants | Nepal | 60.4 /100 | #160 | Good 12.2% |
| Immigrants | Fiji | 59.1 /100 | #161 | Average 12.2% |
| Ethiopians | 59.1 /100 | #162 | Average 12.2% |
| Immigrants | Ethiopia | 58.6 /100 | #163 | Average 12.2% |
| Colombians | 57.8 /100 | #164 | Average 12.2% |
| Immigrants | Albania | 57.7 /100 | #165 | Average 12.2% |
| Venezuelans | 56.9 /100 | #166 | Average 12.2% |
| Immigrants | Chile | 56.7 /100 | #167 | Average 12.2% |
| Immigrants | Venezuela | 56.5 /100 | #168 | Average 12.2% |