Immigrants from Somalia vs Immigrants from Fiji Poverty
COMPARE
Immigrants from Somalia
Immigrants from Fiji
Poverty
Poverty Comparison
Immigrants from Somalia
Immigrants from Fiji
15.8%
POVERTY
0.0/ 100
METRIC RATING
314th/ 347
METRIC RANK
12.2%
POVERTY
59.1/ 100
METRIC RATING
161st/ 347
METRIC RANK
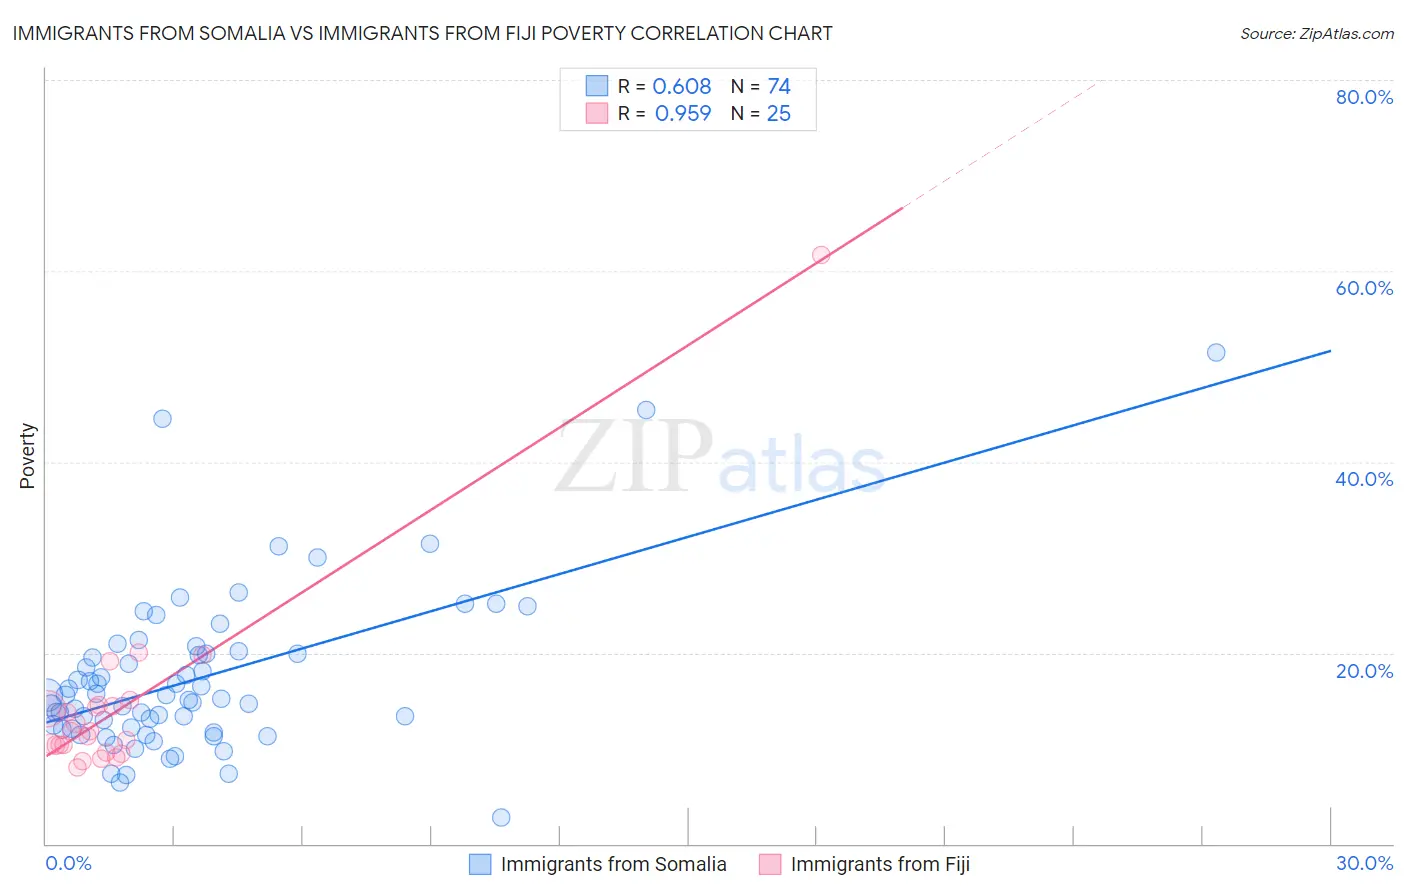
Immigrants from Somalia vs Immigrants from Fiji Poverty Correlation Chart
The statistical analysis conducted on geographies consisting of 92,107,608 people shows a significant positive correlation between the proportion of Immigrants from Somalia and poverty level in the United States with a correlation coefficient (R) of 0.608 and weighted average of 15.8%. Similarly, the statistical analysis conducted on geographies consisting of 93,754,900 people shows a perfect positive correlation between the proportion of Immigrants from Fiji and poverty level in the United States with a correlation coefficient (R) of 0.959 and weighted average of 12.2%, a difference of 29.4%.
Poverty Correlation Summary
| Measurement | Immigrants from Somalia | Immigrants from Fiji |
| Minimum | 2.7% | 7.9% |
| Maximum | 51.5% | 61.7% |
| Range | 48.8% | 53.8% |
| Mean | 17.3% | 14.4% |
| Median | 15.4% | 11.8% |
| Interquartile 25% (IQ1) | 12.1% | 9.9% |
| Interquartile 75% (IQ3) | 19.9% | 14.5% |
| Interquartile Range (IQR) | 7.8% | 4.6% |
| Standard Deviation (Sample) | 8.5% | 10.4% |
| Standard Deviation (Population) | 8.4% | 10.2% |
Similar Demographics by Poverty
Demographics Similar to Immigrants from Somalia by Poverty
In terms of poverty, the demographic groups most similar to Immigrants from Somalia are Immigrants from Grenada (15.8%, a difference of 0.12%), British West Indian (15.9%, a difference of 0.37%), Honduran (15.9%, a difference of 0.37%), Cajun (15.7%, a difference of 0.56%), and Chippewa (15.7%, a difference of 0.72%).
| Demographics | Rating | Rank | Poverty |
| Africans | 0.0 /100 | #307 | Tragic 15.6% |
| Choctaw | 0.0 /100 | #308 | Tragic 15.6% |
| Seminole | 0.0 /100 | #309 | Tragic 15.6% |
| Dutch West Indians | 0.0 /100 | #310 | Tragic 15.6% |
| Chippewa | 0.0 /100 | #311 | Tragic 15.7% |
| Cajuns | 0.0 /100 | #312 | Tragic 15.7% |
| Immigrants | Grenada | 0.0 /100 | #313 | Tragic 15.8% |
| Immigrants | Somalia | 0.0 /100 | #314 | Tragic 15.8% |
| British West Indians | 0.0 /100 | #315 | Tragic 15.9% |
| Hondurans | 0.0 /100 | #316 | Tragic 15.9% |
| U.S. Virgin Islanders | 0.0 /100 | #317 | Tragic 16.1% |
| Immigrants | Dominica | 0.0 /100 | #318 | Tragic 16.1% |
| Immigrants | Congo | 0.0 /100 | #319 | Tragic 16.1% |
| Immigrants | Honduras | 0.0 /100 | #320 | Tragic 16.2% |
| Arapaho | 0.0 /100 | #321 | Tragic 16.3% |
Demographics Similar to Immigrants from Fiji by Poverty
In terms of poverty, the demographic groups most similar to Immigrants from Fiji are Ethiopian (12.2%, a difference of 0.010%), Immigrants from Ethiopia (12.2%, a difference of 0.060%), Immigrants from Nepal (12.2%, a difference of 0.13%), Colombian (12.2%, a difference of 0.13%), and Immigrants from Albania (12.2%, a difference of 0.14%).
| Demographics | Rating | Rank | Poverty |
| Guamanians/Chamorros | 63.9 /100 | #154 | Good 12.1% |
| Hungarians | 63.6 /100 | #155 | Good 12.2% |
| Scotch-Irish | 62.6 /100 | #156 | Good 12.2% |
| Costa Ricans | 62.2 /100 | #157 | Good 12.2% |
| Taiwanese | 61.8 /100 | #158 | Good 12.2% |
| Pennsylvania Germans | 60.8 /100 | #159 | Good 12.2% |
| Immigrants | Nepal | 60.4 /100 | #160 | Good 12.2% |
| Immigrants | Fiji | 59.1 /100 | #161 | Average 12.2% |
| Ethiopians | 59.1 /100 | #162 | Average 12.2% |
| Immigrants | Ethiopia | 58.6 /100 | #163 | Average 12.2% |
| Colombians | 57.8 /100 | #164 | Average 12.2% |
| Immigrants | Albania | 57.7 /100 | #165 | Average 12.2% |
| Venezuelans | 56.9 /100 | #166 | Average 12.2% |
| Immigrants | Chile | 56.7 /100 | #167 | Average 12.2% |
| Immigrants | Venezuela | 56.5 /100 | #168 | Average 12.2% |